Contact us
Get in touch with our experts to find out the possibilities daily truth data holds for your organization.
Persistent Monitoring
Natural catastrophe solutions

Rapidly evolving satellite data provides opportunities for people and businesses around the world.
This page is created for people who are interested in using satellite data for innovative applications enabling faster and better decision-making. We dig into satellite imaging technologies, applications, and benefits, with a more detailed introduction to Synthetic Aperture Radar (SAR) technology and how it can be applied for generating highly actionable information for governments, organizations, and businesses.
The growth of the New Space industry dictates that businesses and governments around the world have an advanced understanding of what possibilities are opened for them. The shortage of popular scientific sources explaining related complex concepts in an easy and commonly understood way should not be an obstacle for anyone who wants to understand satellite data in more detail.
Satellite data or satellite imagery is understood as information about Earth and other planets in the space, gathered by man-made satellites in their orbits.The most common use for satellite data is Earth Observation (EO): satellites deliver information about the surface and weather changes on the planet Earth.
Satellite data is generated via remote sensing technologies. One of these, Synthetic Aperture Radar (SAR) technology, provides reliable and timely data stream opportunities for a myriad of applications at land and sea. For governments and organisations, this means possibilities for acting on time for example in connection of natural catastrophes and crimes, for businesses this enables developing completely new and improved services.
One of the inherent value that satellite data has is the availability of authentic information about Earth surface, weather, and other incidents. Cumulative data helps to understand developments in long-term and timely data to act swiftly on the detected issues. The number of satellite data applications is unlimited, providing manyfold advantages on global and local scale.
Earth Observation (EO) refers to the use of remote sensing technologies to monitor large areas of land, sea, and atmosphere. Remote sensing means observing an object (in this case the Earth) with the help of device which is physically remote from it.
Remote sensing devices with EO sensors can be carried with various platform groups:
Most of Earth Observation data comes from spaceborne platforms with remote sensing tools. Earth Observation through satellites relies on the use of their mounted payloads which collect and transmit images or other data of the Earth’s characteristics. The Earth Observation satellites are normally launched to relatively low altitude orbits (about 600-800 km from the surface of the Earth) to be able to carry out their imaging tasks.
The fundamental differences of EO technologies depend on whether the data is collected through a passive or an active remote sensing system.
Passive remote sensing
A satellite has a remote sensing payload to monitor the solar energy which Earth’s surface or atmosphere reflects and re-emissions into space. This technology delivers data only in sunlit, cloudless circumstances. Commonly used passive sensors include optical and thermal sensors.
Active remote sensing
A satellite sends energy to Earth and then measures the energy received back from the Earth’s surface or atmosphere. Commonly used active sensors include radar and laser technologies. There are two types of radar-based systems that are used for satellite-based microwave imaging:
Active imaging systems, especially Synthetic Aperture Radar, is the only instrument that can penetrate clouds and doesn’t require sunlight to provide reliable remote sensing data. This is especially relevant for monitoring those areas of the Earth which most of the time are covered with clouds, such as in Northern Europe, South American rainforests, or South-East Asia.
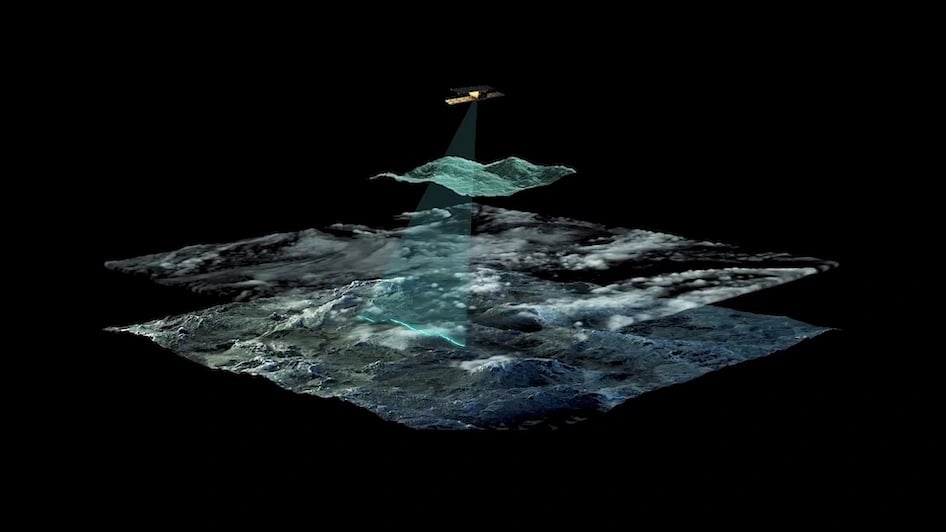
Satellite data enables efficient mapping and monitoring of the Earth’s resources, ecosystems, and events. The information can be used for various scientific, administrative and commercial applications. Accurate information based on satellite data helps users to understand how we humans affect our cities and environments, which in turn enables data-based decisions and actions. Access to timely satellite data gives an opportunity to take action on what is going on right now, on large and small scales.
The use of satellite data helps governments and industries to share information, to make better decisions, to act on time and to provide improved or totally new services. The original raw satellite images contain data with parameters that can be interpreted via remote sensing software. The parameters can be then combined and verified, for example with spatial data, for further analysis. When activities, issues, changes, and trends can be detected, monitored and analysed more efficiently with satellite data, the benefits for people and environment can be tremendous.
Important applications serve the interests of agriculture, forestry, urban development, insurance, energy, and security-related operators and industries, among others. The volume of applications is huge, and it is rapidly increasing thanks to new innovations.
Here are some examples of satellite data uses:
Satellite imagery databases provide access to affordable satellite images. Some of the information is also publicly available. Commercial satellite data providers sell satellite images, data and information, or they can be commissioned to provide continuous delivery of data for example from a specific area.
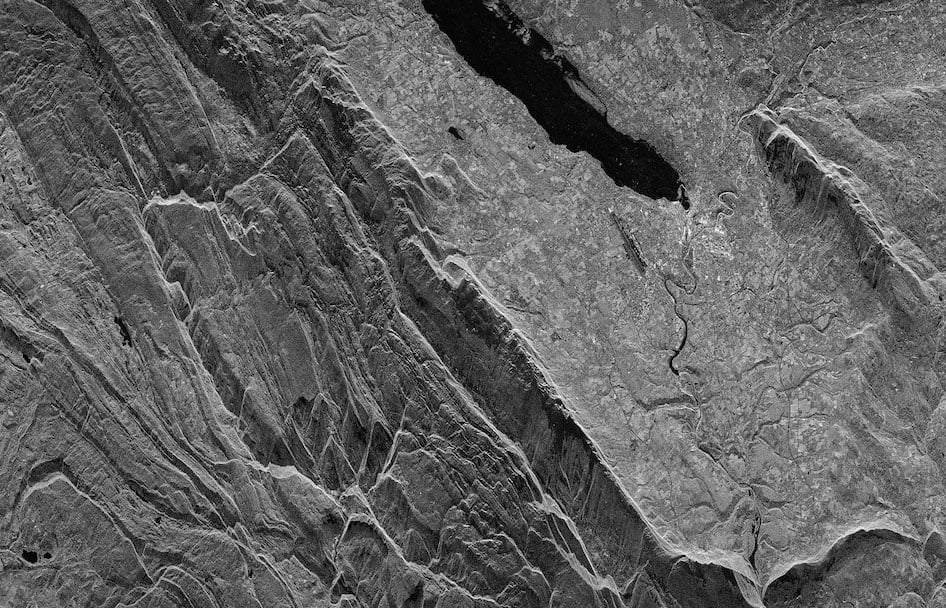
In general, the observations of remote sensing devices are quantitative. The raw data is acquired at predefined coordinates and sensor specifications. The sensors record radiance, which is processed into raw images for further analysis and interpretation. In pre-processing image co-registration and phase calibration is performed. For example, a SAR image processing includes multiple stages, such as range compression and then azimuth compression. After that, the images are also georeferenced. Interpretation and analysis of satellite imagery is typically performed using professional remote sensing software or built-for-purpose algorithms.
Spatial resolution
One of the main features of any satellite imagery is spatial resolution. The race towards improving the spatial resolution is gaining momentum, while such limitation as data bandwidth - the amount of data that can be transmitted during a time period - has restricted the spectral capabilities of many high resolution satellites to just the common four visible and near-infrared bands (this imagery usually consists of red, green, blue, and near infrared bands).
Spatial resolution is understood as the minimum distance between two objects that can be distinguished in an image. The required spatial image resolution depends on the final purpose for doing the initial satellite imaging, and the size of the monitored area. Any Earth imaging satellite’s resolution is practically speaking the shortest dimension on the ground that is formed into a single pixel. 1 meter resolution means that in ideal circumstances (overhead, looking down), each pixel on the image represents a 1m2of the ground area.
The spatial image resolution is determined by a combination of flight or orbit altitude and sensor characteristics. Various sensor attributes can be changed to better serve individual use cases. In the case of SAR, the beam width of the antenna, or pulse time length, or other similar imaging specifications are chosen based on the intended data use case. Spatial resolution of images acquired by satellite sensor systems is usually expressed in meters. For example, 3-meter resolution means that two objects, 3 meters long or wide, sitting side by side, can be separated (resolved) from each other on the output image.
In remote sensing technology, the spatial resolution represents not only the capability to identify the presence of two objects but also their properties. Similar to digital photography, a higher resolution implies better visibility of details represented on the image. In remote sensing, spatial resolution is limited by diffraction, aberrations, imperfect focus, and atmospheric distortion. It is important to consider that the final resolution is affected by these factors. Different objects can be resolved from images with different resolutions. For example, it is possible to detect vessels already at 25 x 25 meter resolution SAR imagery, but at 3 x 3 meter resolution, it is already possible to determine the direction and, in some cases, the speed of the vessel.
Other forms of resolution
Satellite imaging resolution can be spatial, spectral, temporal or radiometric. For radar imagery, spatial resolution in the range of 5-100 meters is classified as high resolution, less than 5 meters resolution is classified as very high. For optical imagery, spatial resolution is considered low if it exceeds 80 meters, medium if it falls in a range between 10–80 meters, high if it is less than 10 meter and very high resolution is everything below 1 meter.
Temporal resolution of a remotely sensed image describes the period of time when it was acquired. The time aspect is particularly important since human activities are also subject to the progress of time. We are strategically dependent on the information of how things change yet we are additionally limited in our capacity to watch these developments in an objective manner.
The frequency of image acquisition is especially relevant for those applications, where time is of greatest importance, such as mapping of landslides, fires, and effects of other natural disasters. Daily coverage is also important for the most use cases on both land and sea. Certain parameters allow for imaging the same area on Earth as often as every 3 hours.
Radar-based satellite imaging is a cost-efficient solution for frequent coverage because overpass times are not affected by cloud cover and weather conditions. This imaging cycle is fixed by satellite’s orbital parameters, which determine what the interval between acquisitions could be. The constellation of ICEYE SAR Satellites offers never-before-seen capabilities in enabling change detection at the high temporal resolution to cover large areas, which higher resolution offerings are not able to support.
Processing satellite imagery
Processing turns the gathered data into reliable and clear images, readable by both humans and algorithms. In data processing, satellite imagery data can be integrated with previously taken and/or different scale satellite imagery, and with spatial or other data sources. The process of utilizing EO data takes place in many steps: from data reception to processing, quality evaluation, information verification and delivery or integration with operative or modeling systems where the information will be utilized.
Machine Learning (ML) algorithms provide effective tools for analyzing satellite imagery, enabling the make of better and more applicable insights. They can be used for modeling or identifying useful information out of a data stream. Machine learning algorithms utilize satellite data and data collected from other relevant sources with complex processes, making the final verification and human interpretation of the information faster and easier. Algorithms are used to scan huge data masses of satellite imagery and to develop models to extract features, detect changes and predict upcoming situations with the help of Artificial Intelligence (AI).
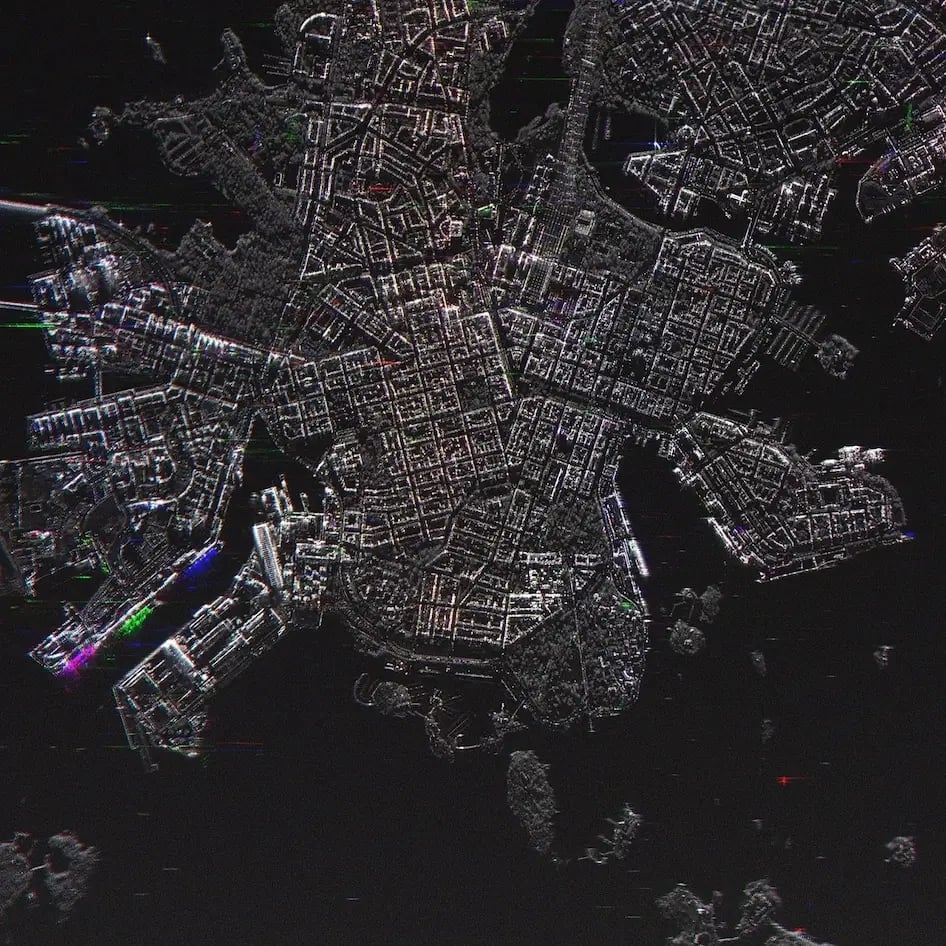
The New Space approach enables rapid development of new technologies and a fast uptake of related data use cases. As more and more actionable satellite data is available, it can be combined with data from other sources, and analyzed with the help of machine learning and artificial intelligence. For the SAR imagery market, new technological developments can be seen in FMCW (Frequency-Modulated Continuous-Wave) radars, high-resolution interferometry SAR, 3D radar, digital beam forming, dual band (Ultra High Frequency/Very High Frequency) sensors are one of the main trends (Markets & Markets, 2017).
Frequently available SAR data is the next developmental step, providing access to timely, reliable and actionable information for more and more organizations and decision makers. Combining optical and SAR satellite data with other data sources will evolve rapidly. In terms of satellite data quality, different resolutions and improvement of radio hardware, satellite lifetime, and a number of available resolutions will also progress fast.
The most common satellite imagery technologies, optical and radar imagery, are used for Earth Observation. SAR active remote sensing technology utilizes various radar wavelengths for different purposes. The imagery is affected also by polarisation and backscattering. Optical satellites have an onboard passive sensor that requires sunlight to work. Optical EO imagery looks similar to how human eye sees the Earth. Both SAR and optical imaging technologies have their advantages and optimal applications.
Satellites with optical sensors represent passive remote sensing technology. They only can generate images of those parts of the Earth that reflect sunlight. In dark or cloudy weather optical imaging is not possible, or returns imagery of bad quality. Optical data includes the visible wavebands and produces images that are similar to the way how the human eye captures the world. In addition to visible light, an optical sensor captures light in the near and middle infrared, that is not visible to the human eye but which contains important surface characteristics information. The resulting reflectance spectrum is analysed afterwards.
A passive sensor records the radiation of its target within a solid angle of view. Near, short and middle infrared wavelengths suit for distinguishing vegetation types with moderate resolution, where pixel size varies from 10 x 10 to 30 x 30 meter. Optical satellite data can be combined with laser data which provides additional information about terrain or vegetation characteristics.
In addition to the actual reflectance of the target surface, the radiance detected by an optical sensor depends on many factors including atmospheric conditions (clear or dusty atmosphere), direction of illumination source (Sun angle), scattering of the target (rough/ smooth surface), orientation of the surface (influences topographic shadowing and/or increased radiation on rolling ground), and view angle of the sensor (nadir looking or off-nadir looking) (CRCSI 2017).
Synthetic Aperture Radar (SAR) satellites enable imagery to be obtained during both day and night-time. In addition, SAR can penetrate clouds and it works in all weather conditions, including rain and snowfall. SAR sensor carries its own illumination source, in the form of radio waves transmitted by an antenna.
"Synthetic aperture" means physically moving the small SAR instrument over an area, while it gathers information of its target, rather than having a very large instrument which would image the same area at once. To achieve this movement, SAR instruments are often mounted on satellites and airplanes, which enables them to cover large areas in a very short time.
SAR synthetically increases the antenna's size to increase the azimuth resolution through the same pulse compression technique as adopted for range direction. A shift in wave frequency is known as the Doppler effect. The distance between the Satellite radar antenna and different reflection points on the Earth's surface are measured and processed into images readable by humans and machines.
Active remote sensing systems operate in the visible and microwave parts of the electromagnetic spectrum. SAR measures microwave response from surface features, potentially by using multiple polarisations. This creates reliable imaging of both land and sea. Imaging can be used for vital decision-making at public and private sectors, where it helps to monitor sea ice, marine or land environments and events, and support acting on crises requiring humanitarian aid.
Due to the nature and variety of observed surfaces, human-made structures are more likely to be visible on SAR images already at a lower resolution. The amount of returning reflection from surfaces is called backscatter. A SAR image is essentially a square raster-based output of the measured backscatter as an image.
Reflectance from a surface is generally not uniform since it varies with the texture of the surface relative to the wavelengths of incident radiation. Reflectance can vary from specular (totally smooth) to diffuse (totally matt), but most surfaces display characteristics between these two extremes. A smooth surface acts as a mirror and is seen as black in the SAR image since the echoes never reach the antenna. For example, ships are seen very well on the surface of the sea.
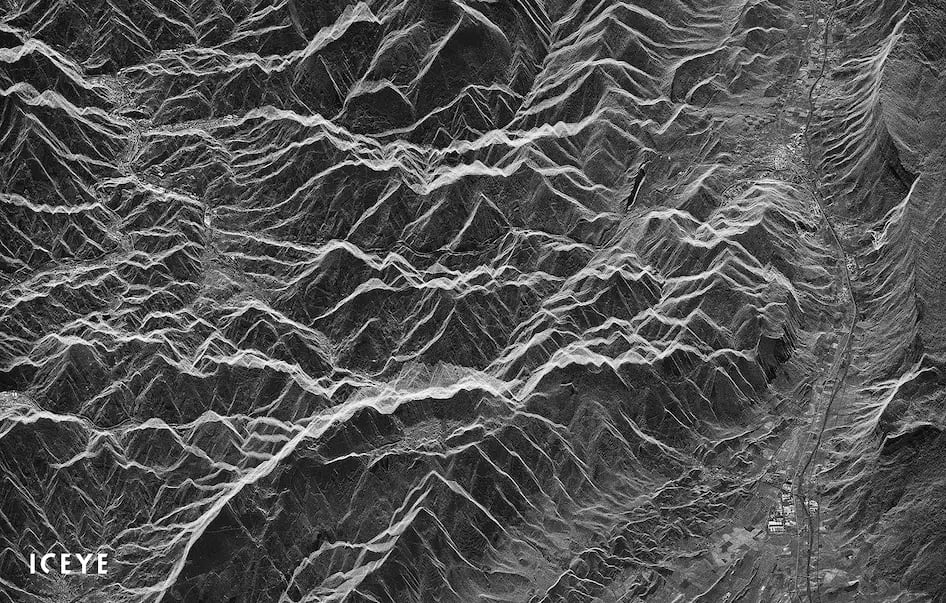
Read the story of this ICEYE-X2 SAR image by Michael Sheetz from CNBC
Radar band, in essence, is a selection of wavelengths or range of radar frequencies. Most commonly used SAR bands are X-band, C-band, and L-band. Each radar band has its own penetration characteristics which are affected by different materials and conditions on the ground.
X-band
With a nominal frequency range from 12.5 to 8 GHz (2.4 to 3.75 cm wavelength) within the microwave portion of the electromagnetic spectrum, X-band is a suitable frequency for several high-resolution radar applications. It has been applied for both experimental and operational airborne and spaceborne SAR systems, designed for various remote sensing applications. The corresponding wavelength for these systems is around 3 cm, which has proved to be useful for mapping and monitoring assignments.
C-band
This band has a nominal frequency range from 8 to 4 GHz (3.75 to 7.5 cm wavelength) within the microwave portion of the electromagnetic spectrum. C-band has been commonly used for several experimental aircraft SAR systems in addition to several single-band satellite SAR systems. The corresponding wavelength for these systems is on the order of 5.6 cm, which proved to be useful in sea ice surveillance and other applications. Like other radar bands, C-band allows to see even through the thick layers of clouds. Its penetration characteristics of vegetation canopies or soils are limited and are only possible for the top layers.
L-band
The nominal frequency range of L-band is from 1 to 2 GHz, (30 to 15 cm wavelength range). The L-band is one of the main operating ranges used by various applications in addition to radars, such as Global Positioning System (GPS), radio, and telecommunications. The L-band has a low bandwidth because of its low frequency which allows also for easy implementation. For example, some materials such as snow and sand can be penetrated to a degree by microwaves. L-band penetration is very consistent, supporting applications such as underground archaeology.
Polarisation
The scattered signal amplitude and polarization provide information about scattering properties and structure. Phase measurements of the return pulse are used in interferometry and other applications. In vegetation canopies penetration example, X-band radar, with wavelengths of around 3 cm, is scattered strongly by foliage, while L-band, with wavelengths of around 27 cm, is scattered more strongly by tree branches.
Mirror reflection occurs for smooth surfaces with a low amount of radiation returning to the sensor. In contrast, rough surface will cause for a bigger amount of radiation to backscatter. If solid targets, such as metal objects, are oriented towards the antenna, they will have a very strong return signal. Amplitude is recorded always, while advanced systems can also measure polarisation and return signal phase.
Imaging radars operate in one or more of the select polarisation modes. Radar system measurements can be single-polarised (HH or VV or HV or VH), dual-polarised (HH and HV, VV and VH, or HH and VV), or quadrature polarised (HH, VV, HV, and VH).
Co-polarised measurements
Cross-polarised measurements
For polarimetric analysis, signal phase differences between the modes and signal magnitude are measured by polarimetric (quadrature polarised) radar and some dual-polarised systems. Orientation and shape of the object surface affect the polarisation of reflected microwave energy in varying degrees. The final appearance of the objects in the images is affected by the polarisation mode trough scattering intensity echo.
Synthetic aperture radar imaging is different from how optical imaging works. While optical cameras rely on light created by other sources, like the Sun, a radar instrument actively sends its own radio waves towards its target and then measures what is reflected back. The radar signals that reflect back from the Earth are received by the satellite antenna and recorded.
Since the inception of satellite imagery, optical images have become a common data format, and 1x1 meter resolution has become a go-to resolution that is familiar from optical imaging. Optical images are relevant for a large variety of use cases, such as very high resolution (25 cm and lower) imaging. However, optical imagery has issues with cloud cover and imaging during the darkness. Although the optical imagery is an extremely important method for Earth Observation, it is not a universal solution. For many applications, SAR technology provides clear results, better reliability, and timeliness.
In the past, reasons for not selecting SAR data over optical data have included potentially higher cost and lower availability of suitable resolution imaging for vast areas, among others. These are exactly the issues that are now being addressed by the ICEYE constellation of SAR microsatellites to better meet the needs of both commercial and government customers.
Synthetic Aperture Radar satellites collect imagery during day and night, in all weather conditions.SAR satellites receive return pulse and based on different angles of this pulse, it is possible to create 3D images. Revisiting the same places in their orbits, SAR satellites create the same image quality regardless of snow and rain. This provides a significant advantage especially for change detection applications at land and sea throughout the globe.
ICEYE has developed innovative radar technology for under 100 kg microsatellites. This technology and optimal resolution choices enable dramatically improved cost-effectiveness over traditional large-size radar satellites.
SAR imagery provides users with increased reliability thanks to its all-weather functionality. In addition, radio bands allow a certain degree of object penetration which helps to identify meaningful features and properties of the Earth and its objects. True characteristics can be determined from SAR imagery, which can only be visible in the radar imagery, such as vegetation, forest canopy, surface roughness, and ice thickness. In general, radar remote sensing advantages include penetration through the vegetation canopy and soil, as well as sensitivity to structure and dielectric properties (liquid vs. frozen water).
The key properties of SAR imaging are:
The constellation of ICEYE microsatellites enable excellent frequency of SAR imaging: the same area is revisited multiple times per day, regardless of imaging conditions. The advantages come via improved speed, frequency, and accuracy of data which all help to create cost-effective monitoring solutions. Further savings are gained through getting actionable information at the right time.
Depending on the purpose of monitoring, preventative actions on detected and analysed deviations can be taken when needed, rather than guessing when and where to act which is the case when the information is limited.
ICEYE SAR satellite technology enables:
Individual ICEYE microsatellites will form a constellation (network of satellites) which enables excellent imaging frequency of several times a day. This will provide global coverage and enable new missions and performance capabilities: ICEYE’s goal is to provide timely and reliable information for decision-makers of every square meter of the Earth every hour.
While SAR satellite imagery seems to provide interesting opportunities for a specific use case, the first step is to consider in more detail if the technology is applicable and suitable for the task at hand. A reliable partner helps to evaluate how SAR imaging stream or imaging tasks help to create actionable information and what kind of data combination, verification, and analysis services are needed.
SAR imaging technology enables better grounds for decision-making thanks to reliability and frequency of the satellite data, sufficient coverage and resolution of the images as well as easy-to-apply data integrations with the existing operating systems.
The process of turning satellite data into useful information takes place in several steps. As satellites can be equipped with different type of sensors, the data content of the acquired images is different, too. Consequently, the raw data source, analyzing tools, and processes needed for turning the imagery into valuable information must be chosen carefully, starting from the purpose and end use of the information.
Recent advances in analysis methods have opened a wide door to applying machine learning and artificial intelligence in turning satellite imagery into actionable information.
The acquired satellite imagery is first downlinked to a ground station and prepared for analysis. This stage can include steps such as lining up pixels, removing clouds and mist, polar reformatting (for SAR data), and so on, depending on the type and end use of the satellite data.
In many use cases, satellite data is analyzed together with data from other sources. For example, a Geographic Information System (GIS) analysis can combine optical and radar data, digital elevation models, and digital orthophotos, providing an analytical foundation for modeling and feature extraction. Satellite imagery has raster (cell-based) layers which can be used to map and model virtually anything that happens on the Earth. Such cell-based data structure enables systematic and controlled analysis with multiple data layers.
The goal of any style of information design is to highlight what is significant in the acquired data. Visualization of satellite data improves our understanding of the significance as it is often difficult to understand what massive amounts of numerical data really tells us.
Here are some examples of satellite data analyzing methods and their applications:
Change detection analysis
Information on how a selected area has changed between two or more time periods is helpful for understanding and evaluating, for example, forest coverage, ice sheets, and urban land use. Satellite imagery can be used to automate the classification and locations of land into specific categories, such as different types of land uses and land cover. Image differencing and change dynamics analysis help to evaluate past changes in relation to the present, as part of assessing the accuracy of the change detection technique.
Image segmentation analysis
Segmentation of satellite images enables various monitoring tasks, from movements of populations in remote areas to evaluate the potential roofs for solar panel installation. Each pixel in the data is classified and grouped with similar pixels and an average value is assigned to the grouped pixels. Machine learning models based on segment analyzed satellite images and ground-based data can automatically detect objects of interest on the Earth’s surface.
Suitability analysis
Suitability analysis using GIS and satellite imagery improves the correctness of land use classification and urban structure analysis. The information is used for selecting suitable places for building or preservation, for agriculture, and so on. Site selection analysis can be performed with vector or raster data.
Visibility analysis
Visibility analysis is used mainly for land use planning purposes. Visible information of a location can be used, for example, for determining the value of a real estate and for selecting locations of telecommunications towers. An output raster displays what entities can be seen over a certain landscape, from the point of view of one or more objects. Simulation tools help to create a 3D environment using DEM files and shapefiles of the targeted objects (like buildings).
Urban footprint
Rapid population growth and constrained operating budgets can hinder or stop maintenance on aging infrastructure, and slow down new developments. Satellite radar data provides city planners accurate information about urban footprint over large areas, allowing decision makers to identify illegal constructions. Single SAR satellite image can be processed to extract multiple texture features to be analyzed for the classification of urban footprint (such as buildings, infrastructures, etc.). The result of this classification is then combined with optical data to reveal the extent of urban footprint over the examined area.
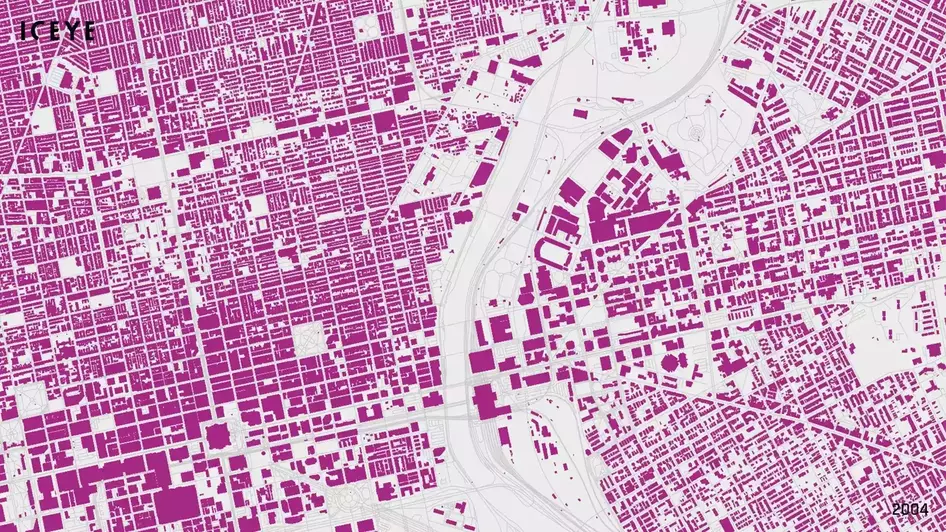
Changes in urban footprint over one area of Philadelphia city between 2004 and 2014
Increasing availability of satellite imagery influences many global and local processes and industries.Accurate information helps to understand how the world is changing on a day-to-day and hour-to-hour timescale. SAR imagery proves changes in long-term and shows what is going on right now.
The applications vary from large scale to very local issues: for example from natural disasters to identifying sea traffic in a selected area. The applications can be categorised for example, to land and maritime end uses.
For maritime use cases, SAR satellite data provides three main benefits compared with optical data:
For land use cases, SAR satellite data provides these main benefits compared with optical data:
The wellbeing of human race largely depends on the state of the Earth resources. In order to be effective in managing land resources and rapidly reacting to changes that occur around us, governments and corporations need to have access to a stream of reliable data, which will not be subject to atmospheric changes. According to NASA, about half of the total land area is usually covered with clouds. For example, there is a particularly cloudy zone over the equator which is very often covered by thick clouds, preventing optical remote sensors to picture the land below them regularly.
The land applications of SAR satellite data range from agriculture monitoring and forest mapping to urban infrastructure surveys. The information is applicable for governmental, non-governmental and business specific needs. The most important applications are
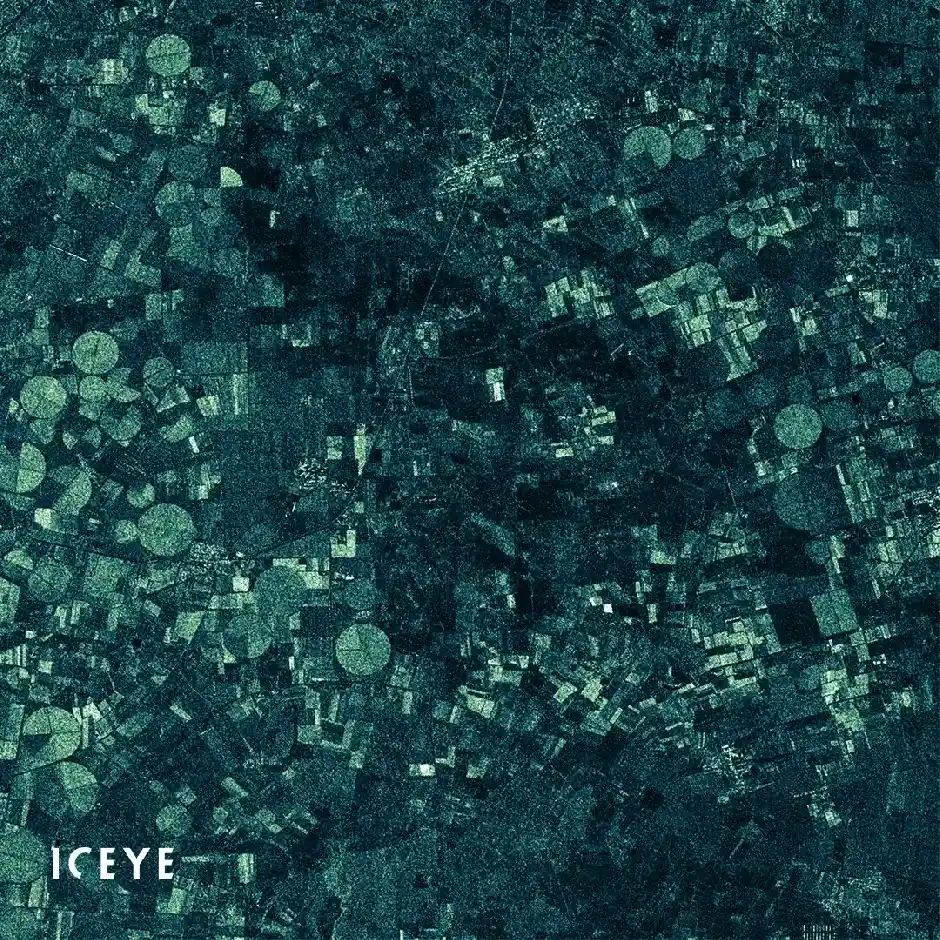
Changes in field harvest detected from ICEYE-X1 imagery (featured in Quartz)
Approximately 71% of the Earth surface is covered by water. For a vast range of maritime uses, the currently available technologies have been stretched to their limits and are lacking in their frequency of reliable imaging. Only limited portions of information can be acquired from the ground, therefore, SAR satellite monitoring solutions are almost the only solution to provide reliable and timely results. Constellation of 18 satellites covers the vast majority of the Earth land and sea areas.
The sea applications of SAR satellite data range from weather and iceberg monitoring to the tracking of sea traffic and natural or man-made catastrophes, like tsunamis and oil spills. The information is applicable for governmental, non-governmental and business specific needs. The most important applications are
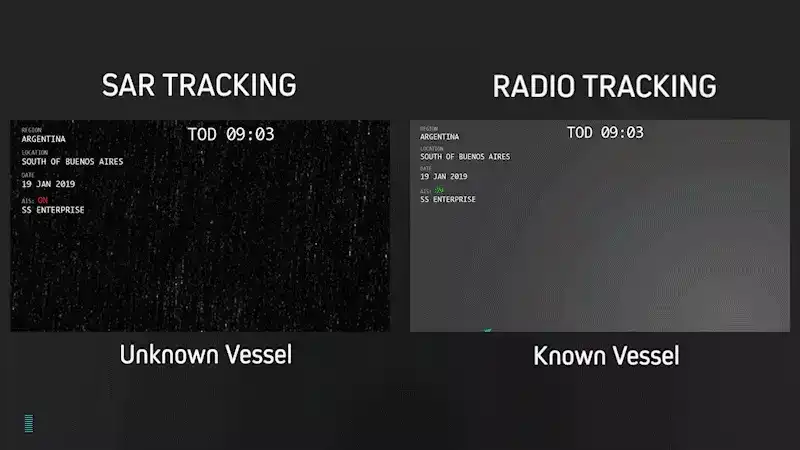
SAR + AIS data fusion from ICEYE and Spire
The key to understanding how to use satellite imagery lies in the understanding of the properties and features of the imagery. Depending on a certain application, requirements for information derived from satellite imagery can be different. For more advanced use cases, involving AI or interferometry, the help of an expert is needed, and ICEYE is here to provide all the information you may need to assess your options.
We are more than willing to learn about the problem you are looking forward to solving with a help of valuable information derived from satellite imagery. Our experts can suggest ways of achieving world-class results with the innovative technology of ICEYE. Usually, initial steps involve determining geographic area of interest (AOI) and the use case description. It is important to understand how often do you wish to receive images and which system are you going to use to analyze the information. To explain better, here are the examples of use cases:
Maritime operator with a fleet of cargo ships wants to have timely information about ice along the routes of the ships.
Sea route of the ship will be set as an area of interest and imaging with SAR satellites will be tasked for every X hours. The images will be taken no matter the weather, throughout all day and at night. Ship operators will feel safe and sure of the company’s operation and safety of the personnel aboard a ship will not be compromised by uncertainty and infrequent information stream.
Large oil company wants a reliable and persistent monitoring of the pipeline section in the rural area.
Geographic area to be covered will be determined together with the company, and revisit times will be set to X hours. ICEYE satellites will monitor the area and alert Oil company if anything suspicious happens on their territory directly through the operating system used by the Oil company. From now on, Oil company will have a continuous stream of security surveillance data over its premises in the rural area.
National coast guard authorities of a small country want to keep track of all the vessels in their EEZ.
The size of the area of interest (AOI) would be equal to the size of the EEZ of this country. Ideally, authorities would like to have coverage as frequently as possible, but at least 5 times a day. It means that satellites would need to pass the set AOI approximately every X hours. ICEYE constellation will be able to fulfill this requirement with at least 3 satellites. This will help country’s authorities to combat illegal fishing and human and drug trafficking, as well as be alert in case a natural catastrophe occurs.
EO College Online Courses.
https://eo-college.org/courses/echoes-in-space/
CRCSI (2017) Earth Observation: Data, Processing and Applications. Volume 1B: Data—Image Interpretation.
ESA (2018), History of Earth Observation.
http://www.esa.int/SPECIALS/Eduspace_EN/SEM1NP3Z2OF_0.html
Relevant social media accounts to follow:
Copernicus EU @CopernicusEU
European Space Agency @ESA
Michael Sheetz @thesheetztweetz (CNBC)
Cade Metz@CadeMetz (NYT)
Alex Knapp @TheAlexKnapp (Forbes)