Contact us
Get in touch with our experts to find out the possibilities daily truth data holds for your organization.
Persistent Monitoring
Natural catastrophe solutions
28 November 2024 | Earth Observation,Data,Missions
11 min read
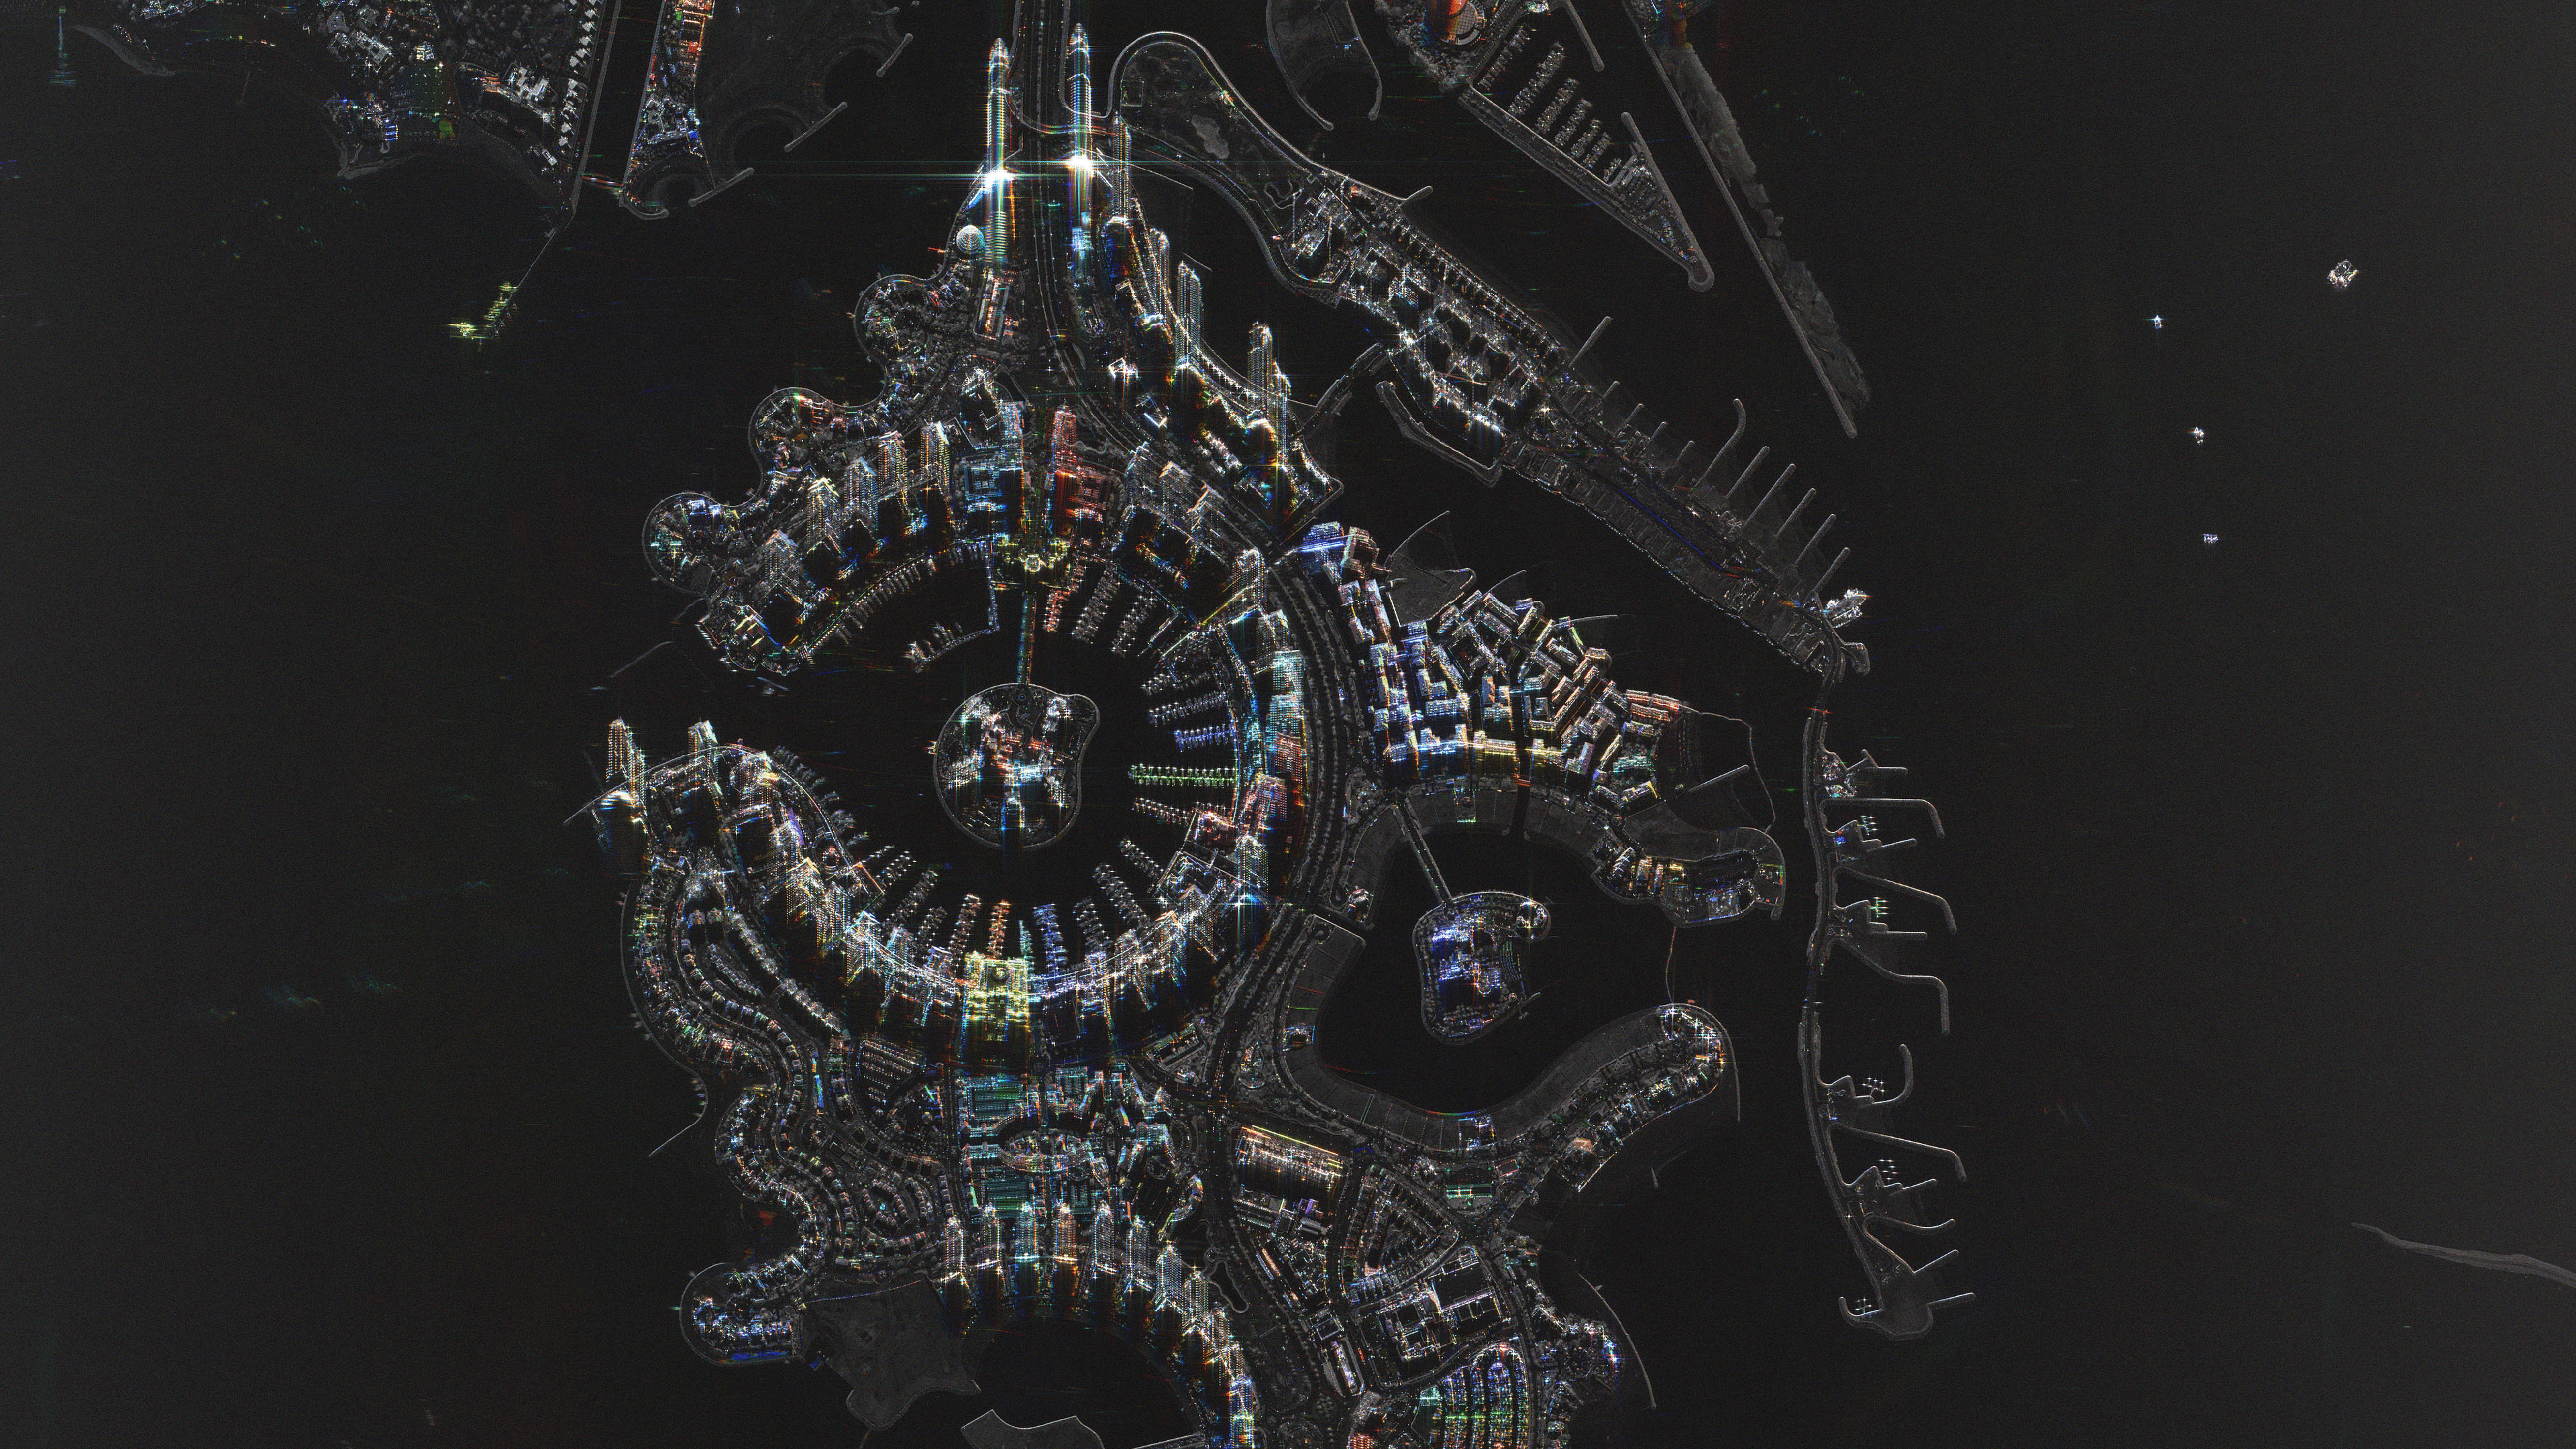
Through this technique of synthetic aperture radar (SAR), our constellation of small satellites gathers enough data to produce a wide variety of images of the earth’s surface, showing everything from the fluctuating volumes of oil storage tanks to the movements of a glacier over the course of a year.
In this blog post, we'll be taking a closer look at the different types of SAR imagery:
A Ground Range Detected (GRD) amplitude image is the standard product for most users and, as you can see, it provides a monochrome depiction of structures on the ground. But this is by no means the only kind of image we can produce.
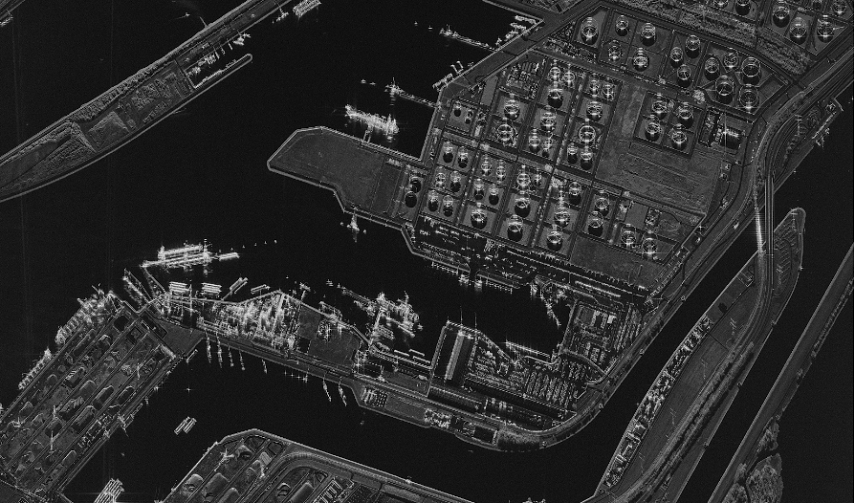
A SAR Ground Range Detected (GRD) image of the Port of Rotterdam, the Netherlands.
ICEYE satellites operate in four different modes: Spot, Strip, Scan and Dwell.
In Dwell modes, the satellite collects information on the same area of ground for a full 25 seconds. This results in a synthetic aperture of approximately 190 km (astonishing, given the antenna itself is only 3 m long).
Using such a massive synthetic aperture enables us to create what we call ‘color multi-look’ or 'colorized sub-aperture' (CSI) images, like the example image below of Pearl Island, Doha, Qatar. Notice the different colored features visible at various points across the picture.
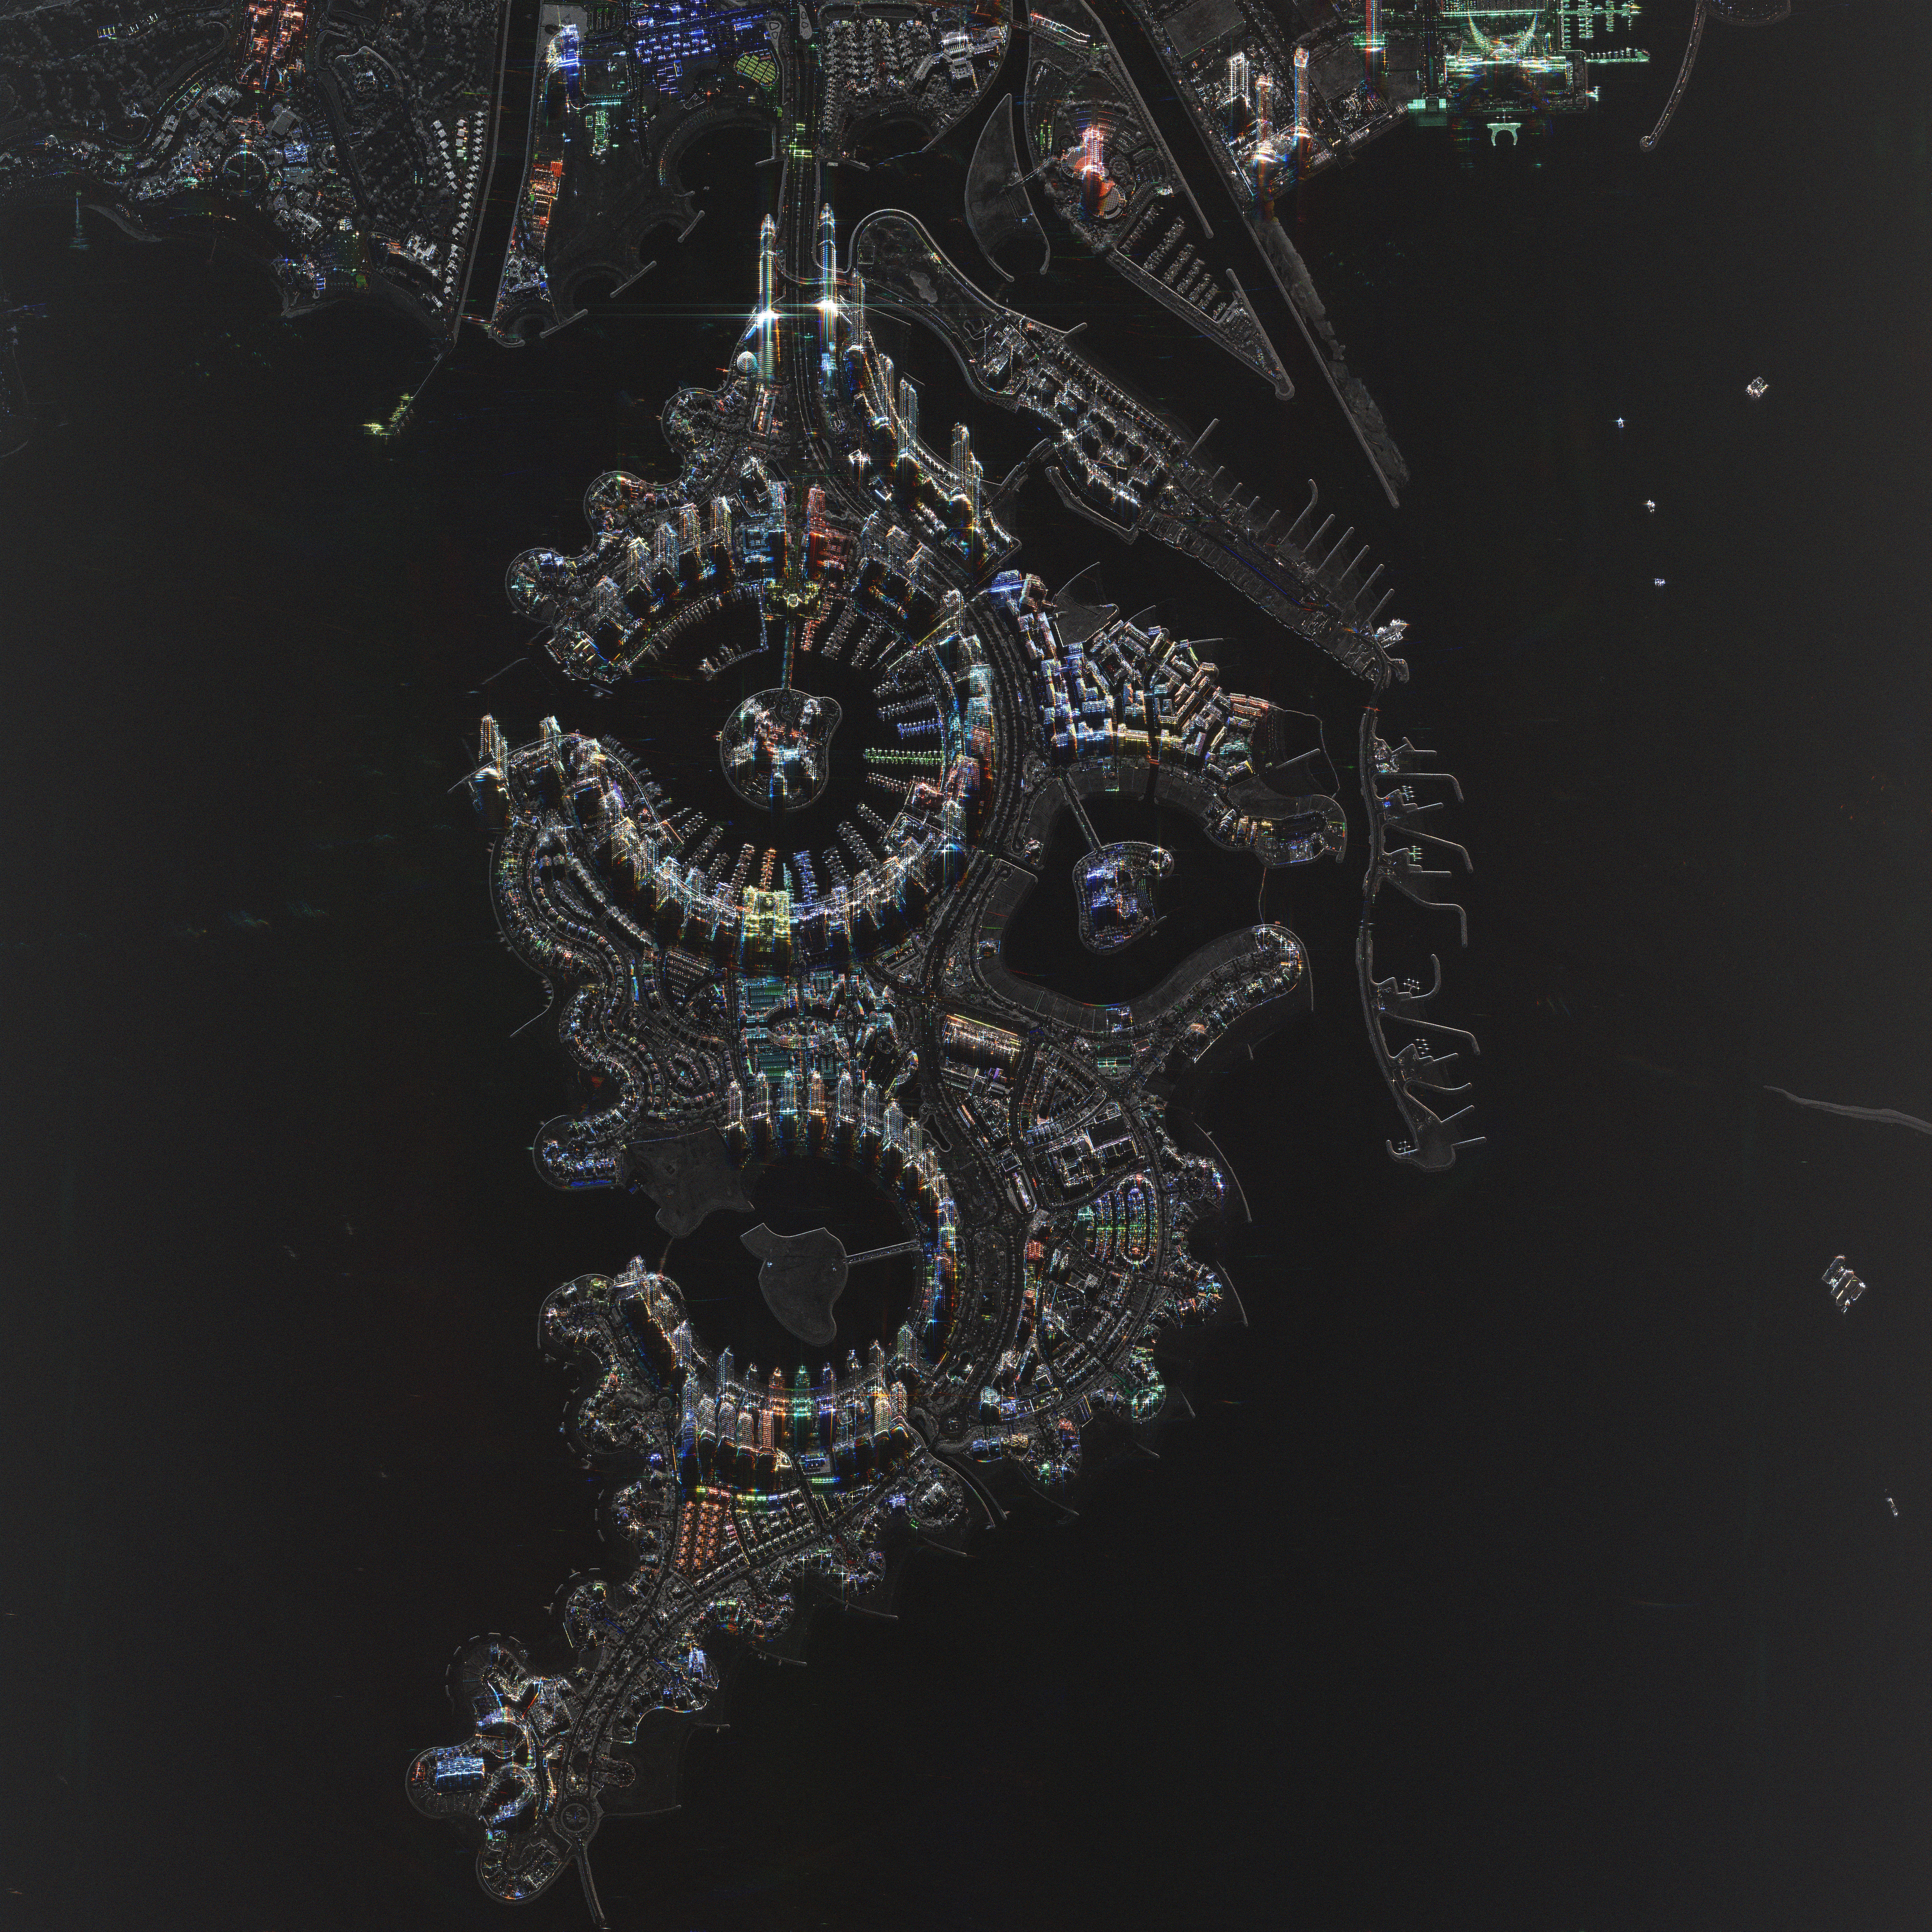
Dwell Fine mode color multi-look image of Pearl Island, Doha, Qatar.
What is happening here? Well, for color multi-look images, we split the aperture into thirds. The first third is projected in red; the second is projected in green; the third is projected in blue. We then combine the three versions. If the reflections are alike, the red, green and blue will combine to form a gray pixel in the final image.
Natural objects, such as trees, grass and water, usually show up gray in multi-look images because they tend to reflect alike across the full aperture. However, human-made structures tend to create dihedral or trihedral reflections when they are at certain angles to the antenna. The reflection is therefore likely to be much stronger (and the pixel much brighter) in one of the aperture thirds, creating a final image where the object appears red, green or blue.
The value of these images is that the color instantly draws the eye to the structures that are human-made.
We saw how the aperture was split into thirds to create color multi-look images. Now imagine that we split it into six or even eight sub-apertures to create a sequence of lower-resolution amplitude images. By playing these images one after another, we can create what you might call a sub-aperture ‘video’ that shows the movement of objects on the ground, as exemplified below.
By combining two colored SAR images, we can see where, how and (roughly) when areas on the ground have changed. We call this Amplitude Change Detection (ACD).
Below, for example, are two images of the same Rotterdam port taken at different times. The image taken first is projected in red. The image taken second is projected in cyan.
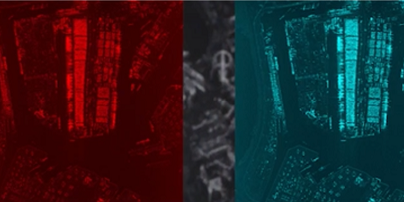
Example of an Amplitude Change Detection image of the Port of Rotterdam, the Netherlands.
"Red is fled. Blue is new"
We have a saying to help remember how the color coding works in Amplitude Change Detection imagery: Red is fled, blue is new. In other words, if the object is red then it moved away (fled) before the second image was taken. If the object is blue (or, more accurately, cyan), then it appeared after the first image was taken.
You can see this effect below where we combined two images of the Port of Rotterdam to create an Amplitude Change Detection image.
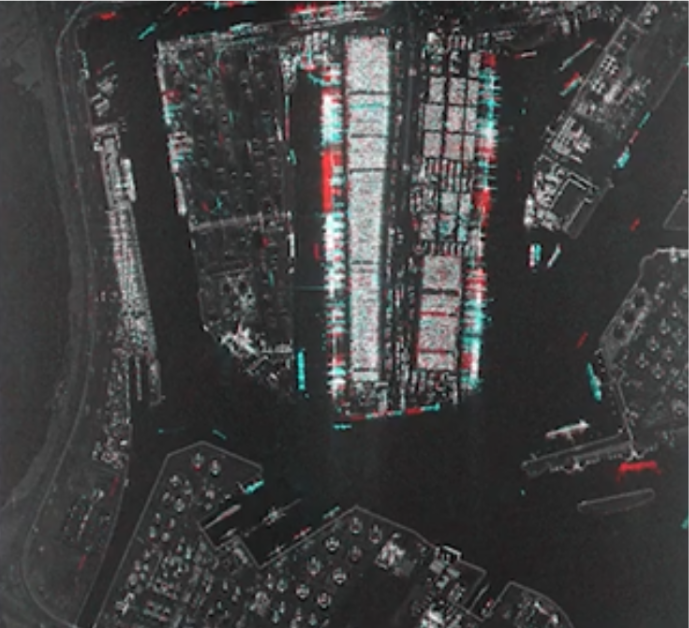
Example of an Amplitude Change Detection images of the Port of Rotterdam, the Netherlands.
We can apply the change detection process not just to amplitude but to phase information as well. The advantage of doing so is that the phase resolution is significantly less than a single wavelength and, as such, is sensitive to changes happening at a much smaller scale, for example highlighting the tracks left by vehicles moving over grass.
The latest generations of ICEYE satellites are all set up to perform Ground Track Repeat (GTR) collections, which is where we collect an image of the same site every 24 hours until we have built up a stack of images that show what is happening to the area over time. GTR is ideal for long-term change detection and site monitoring.
The video below, for example, shows day-by-day movement of vessels and cranes in the Port of Rotterdam, the Netherlands. Again, we can perform the GTR process on phase pixels as well as amplitude pixels, showing how even very small details on the ground are changing over time.
Interferometry is the technique of making two phase data collections from two places slightly offset from each other. As you can see in the illustration below, the range to the first is slightly different from the range to the second – and this is going to cause phase changes, which allow us to take extremely precise measurements. (Remember, it was through phase changes that scientists were first able to detect Einstein’s gravitational waves.)
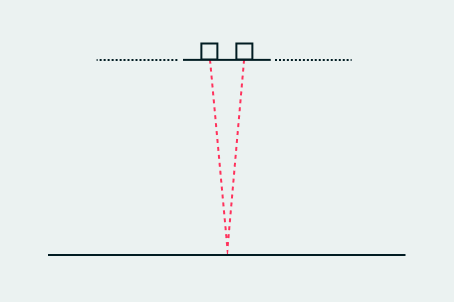
The technique of making two phase data collections from two places slightly offset from each other is called interferometry.
With SAR, we use interferometry to measure topography and ground motion. More specifically, we use differential interferometry, which is when you measure changes between pairs of images rather than individual images.
GTR provides us with stacks of paired images that are ideal for differential interferometry. They enable us to measure ground motion along the line of site with millimeter-scale precision.
To learn how images can be created with a GTR stack using differential interferometry, see Michael Wollersheim's article on Beyond Change Detection: Measuring the Changes that Matter
Our mission at ICEYE is to provide guaranteed and coherent access to the cloud-shrouded planet we call home. We do it through a diverse range of products, including multi-look images, sub-aperture videos, and the variety of image types that can be derived from Ground Track Repeat stacks.
All these products are made possible by our constellation of small, versatile satellites – and new products can be added at any time through a simple software upload.
Hopefully, this brief introduction has opened your eyes to the potential of SAR. In our next article, we are going to look at some of the specific ways in which it can be used to mitigate, solve, and respond to time-critical events and global perils.
06 November 2025
Beyond the Echo - How satellites steer the radar beam
Shikha Sharma and Leszek Lamentowski reveal the technology behind ICEYE SAR satellite agility.
Read more about Beyond the Echo - How satellites steer the radar beam →27 June 2025
Beyond the Echo - Rapid-fire imaging, on repeat
Shikha Sharma and the ICEYE team explore physical maneuver, electronic beam steering, and optimized...
Read more about Beyond the Echo - Rapid-fire imaging, on repeat →13 March 2025
Harness the magical property of SAR
Learn how phase information - that magical property of SAR - can be combined with persistent...
Read more about Harness the magical property of SAR →