Contact us
Get in touch with our experts to find out the possibilities daily truth data holds for your organization.
Persistent Monitoring
Natural catastrophe solutions
20 November 2024 | Solutions,Insurance Solutions,Government Solutions
7 min read

As a Gold Esri Partner, ICEYE delivers unparalleled persistent monitoring capabilities within Esri’s ArcGIS Platform to detect and respond to changes in any location on Earth, faster and more accurately than ever before. This tutorial utilizes the Kakhovka Dam Sample Dataset featured in the ArcGIS Living Atlas of the World.
Over 20 years ago, Jack Dangermond, the founder and president of Esri, envisioned people collaborating and sharing how GIS affects everyone. This led to the establishment of GIS Day, which was first observed in 1999. The explosion of geospatial technology since then has expanded that idea into a global event that shows how geography and the real-world applications of GIS are making a difference in business, government and society. It's a chance for organizations to share their accomplishments and inspire others to discover and use GIS.
This November, ICEYE will join hundreds of organizations worldwide in hosting in-person and virtual gatherings that will celebrate the impactful work of GIS professionals and serve to ignite the imagination of the future innovators who will further advance global progress using GIS.
"GIS Day is a wonderful opportunity for professionals from around the world to get together to share their amazing work," said Dangermond." These individuals are using GIS technology to take a geographic approach in addressing unprecedented challenges, from COVID-19 to climate change. Organizations across the globe are taking part in grassroots events that help celebrate geospatial science and how it impacts the real world for good. Our users should be proud of their achievements in the field, which GIS Day is meant to showcase." For more information on GIS Day, visit https://www.gisday.com/en-us/overview
 The ICEYE Solutions Team with Jack Dangermond.
ICEYE bridges the gap between information and actionable data by combining imagery with multiple auxiliary information sources to create fully operationalized flood hazard insights. We provide near real-time data for flood depth, extent, and duration, within hours of a given flood peak, empowering our clients to calculate losses and carry out disaster response efforts in a more effective and targeted manner. ICEYE’s analysis is based on observations of the flooding, not modeled outputs, and details the impact at a significantly improved resolution and speed compared to other data available. Read more on the ArcGIS Marketplace.
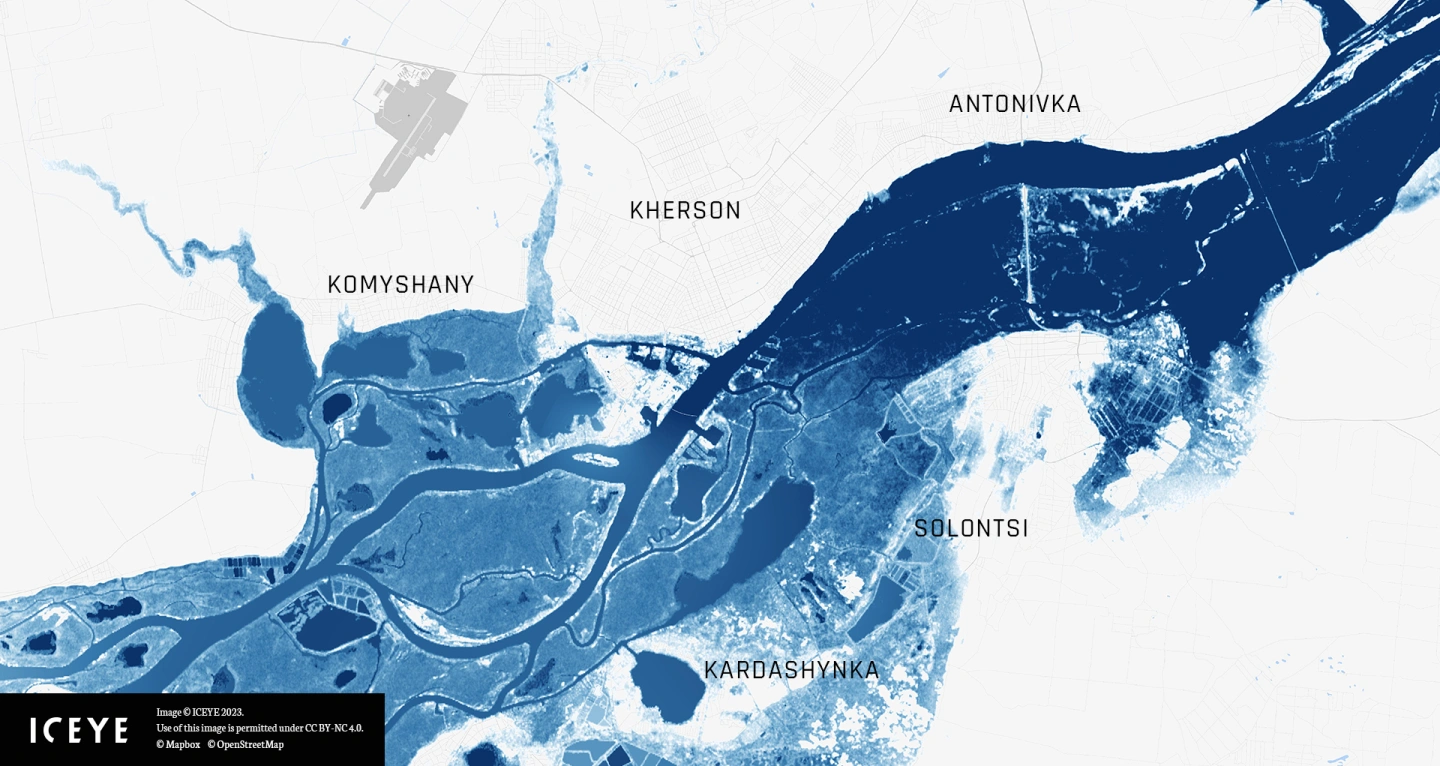
On June 6, 2023, substantial damage to the Kakhovka Dam in Ukraine caused a complete failure, resulting in extensive flooding downstream. The next day, between 7-8th June, 2023, ICEYE’s flood analysis was used by Esri's Disaster Response Program (DRP), The Washington Post, Al Jazeera, and Helsingin Sanomat, to show the impact on the Kherson Region in Ukraine after the Kakhovka Dam breach. According to our analysis, covering the entire extent of the flood, several towns and villages along the Dnipro River were partially or completely inundated. To learn more background about this event, visit: https://www.iceye.com/blog/kherson-ukraine-flooding-kakhova-dam-breach
This event’s Flood Insights dataset was released publicly in the ArcGIS Living Atlas of the World as CC-BY-NC 4.0, allowing non-commercial use with attribution, requiring that All Products and Derivatives shall include the following copyright notice on or adjacent to the Product or Derivative: [Product or Derivative] © [YEAR] ICEYE.
Esri Disaster Response Program : ICEYE Dnipro River Flooding Web App, 6 June 2023.
As a first step, you'll need to find our dataset. Esri provides several ways to get started by locating the open dataset. Navigate to the URL ICEYE Flood Insights Sample Data - Kakhovka Dam to open the item details page for the dataset. Alternatively, you can visit ICEYE’s Active Flood Event Dashboard, to open the pop-up to the event, or search for “Flood” or “ICEYE” in the ArcGIS Living Atlas of the World.
 Your screen will look like this.
From here, the tutorial will guide you step-by-step to explore and visualize flood event data using ICEYE’s Flood Insights dataset in the ArcGIS ecosystem. You’ll start by finding the dataset through several easy access points, then load it into your preferred GIS platform—whether it’s ArcGIS Online, ArcGIS Pro, or Enterprise. From there, you’ll learn how to customize visualizations to highlight key details, like flood depths and affected areas, using advanced symbology and transparency settings.
You’ll also discover how to add contextual layers, such as demographic or geographic data, to assess the flood’s broader impact on communities and infrastructure. Along the way, you’ll use tools to measure distances, interpret pixel values, and refine your map’s presentation. By the end, you’ll be ready to save, share, and even publish interactive maps, apps, or printed outputs to communicate your findings effectively. This is your chance to turn raw flood data into actionable insights and share them with the world.
You can access the full step-by-step instructions via our Esri ArcGIS StoryMap here.
05 March 2025
Beyond 99% Precision: How ICEYE’s observed data improved wildfire response in Los Angeles
Discover how ICEYE’s observed wildfire data helped insurers and emergency managers respond to the...
Read more about Beyond 99% Precision: How ICEYE’s observed data improved wildfire response in Los Angeles →19 February 2025
Insurers' guide to accessing and visualizing ICEYE Flood Insights
Learn how insurers can make insightful business decisions with ICEYE Flood Insights and all the...
Read more about Insurers' guide to accessing and visualizing ICEYE Flood Insights →16 December 2024
Atlantic hurricane season 2024 wrap-up: trends, impacts, and future risks
Read ICEYE's summary of the 2024 Atlantic hurricane season to understand trends, impacts, and...
Read more about Atlantic hurricane season 2024 wrap-up: trends, impacts, and future risks →