Contact us
Get in touch with our experts to find out the possibilities daily truth data holds for your organization.


Whether you’re a small team with limited technical resources or a large enterprise with advanced GIS capabilities, we offer a range of solutions designed to fit your needs and skill level. Our flexible solutions empower you to integrate high-resolution flood data into your operations effectively. This flexibility enhances decision-making, reduces risks, and provides actionable insights when you need them most.
We provide multiple methods to access ICEYE’s flood data that are tailored to your workflows. In the first part of this blog, we’ll explore the different options for easily accessing our Flood Insights.
For users of free geospatial tools or platforms, ICEYE can upload Flood Insights files to an accessible location for easy download and use within your preferred visualization tool.
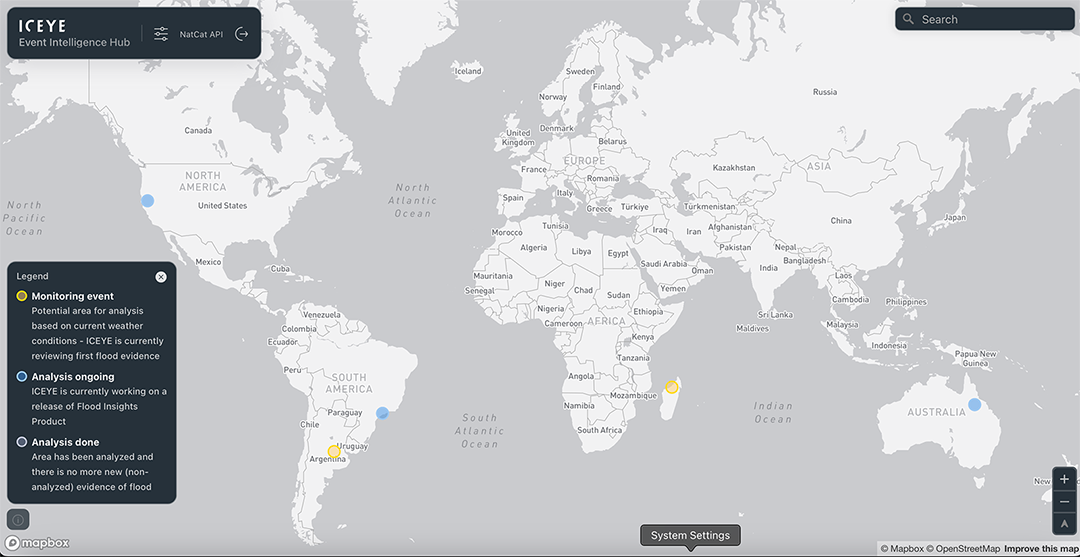
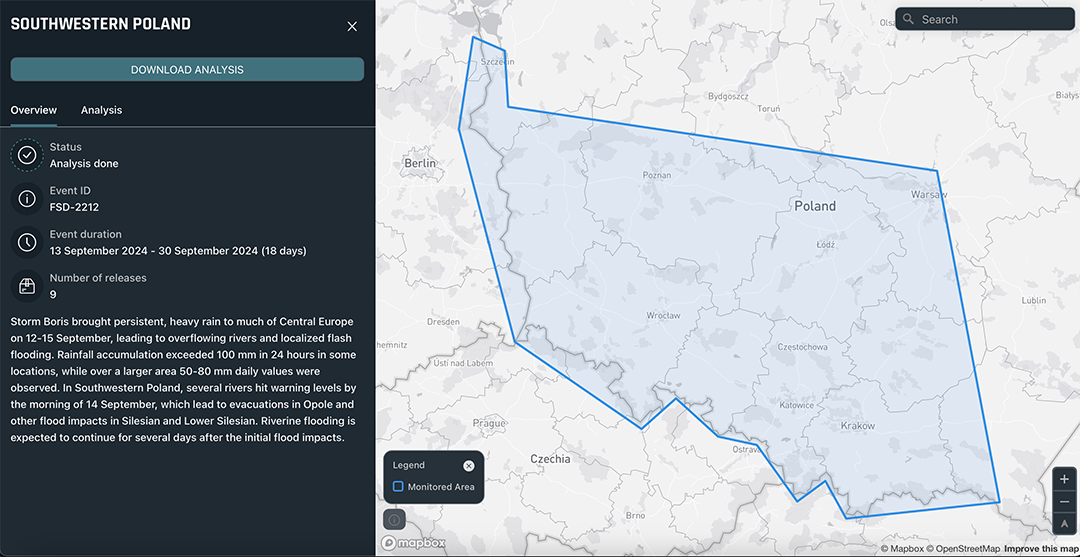
Our Event Intelligence Hub is a web-based platform serving as a central repository for up-to-date flood event information. The platform enables you to monitor ongoing events we are analyzing and download flood events of interest to you.
It is built to be accessible to anyone, regardless of technical expertise. With easy-to-read visuals and downloadable data, you can take immediate action to mitigate risk or make informed decisions related to flood events.
For more technically advanced users, ICEYE offers the ability to upload and access flood data via our API. This integration allows for a completely automated process and accelerates decision-making by streamlining workflows and eliminating manual steps.
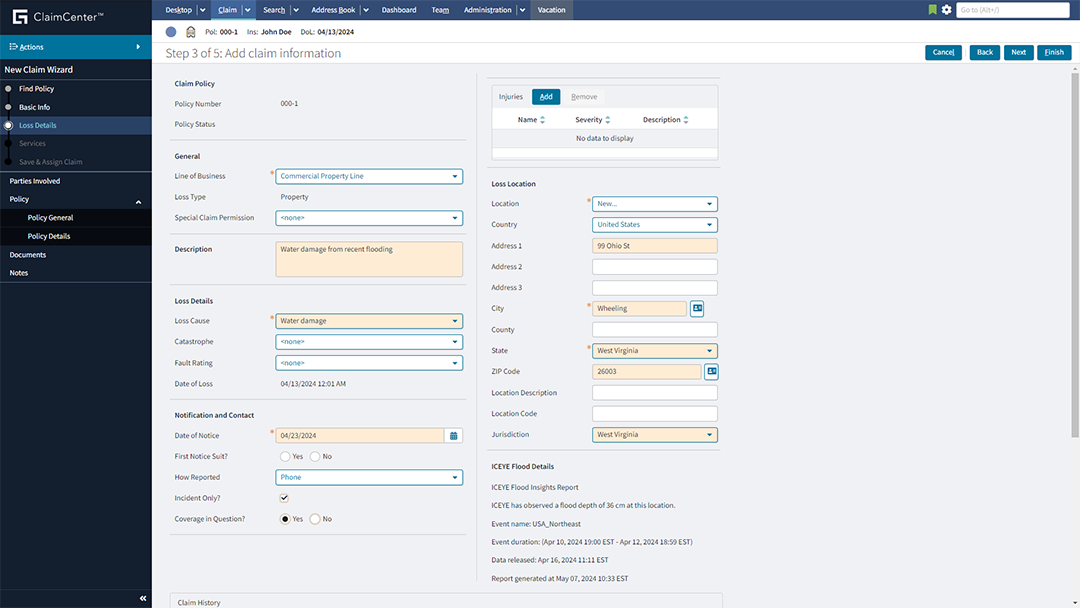
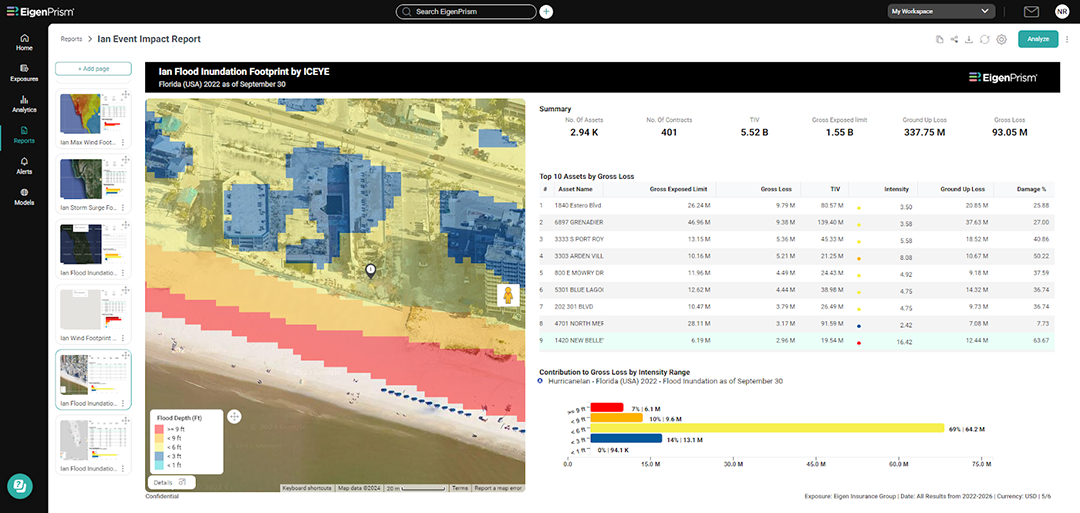
ICEYE Flood data is available on many of our partner platforms. These include claims management platforms such as Guidewire and Duck Creek, exposure management solutions like EigenRisk and Opterrix, geospatial analytics software like Insurity, property analytics such as Nearmap, or event response & planning solutions like Arturo. If you're using one of these, it's simply a matter of the partner granting you access as needed. If you are using a platform we are not partnered with yet, we are always happy to work with them to get this integrated into your workflow to fit your business needs.
Depending on your organization's capabilities and requirements, the ability to visualize and access ICEYE’s flood data can vary from straightforward to highly technical. We work closely with each customer to ensure they have the right tools and support to make the most of our data, whether you’re looking for simple data visualization or deeper technical integration.
Let’s take a look at all the available options.

For organizations requiring simple, intuitive access, you can visualize flood data (extent & depth) in customized administrative zones like postcodes, counties, regions, or a more general hex grid-based map focusing on your areas of interest. These visualizations can be accessed through ICEYE’s web view or exported to an Excel spreadsheet, giving you a clear overview of flood risks in your areas of interest. ICEYE can support the development of a custom, tailored, and comprehensive solution, including the integration of client exposure data if requested.

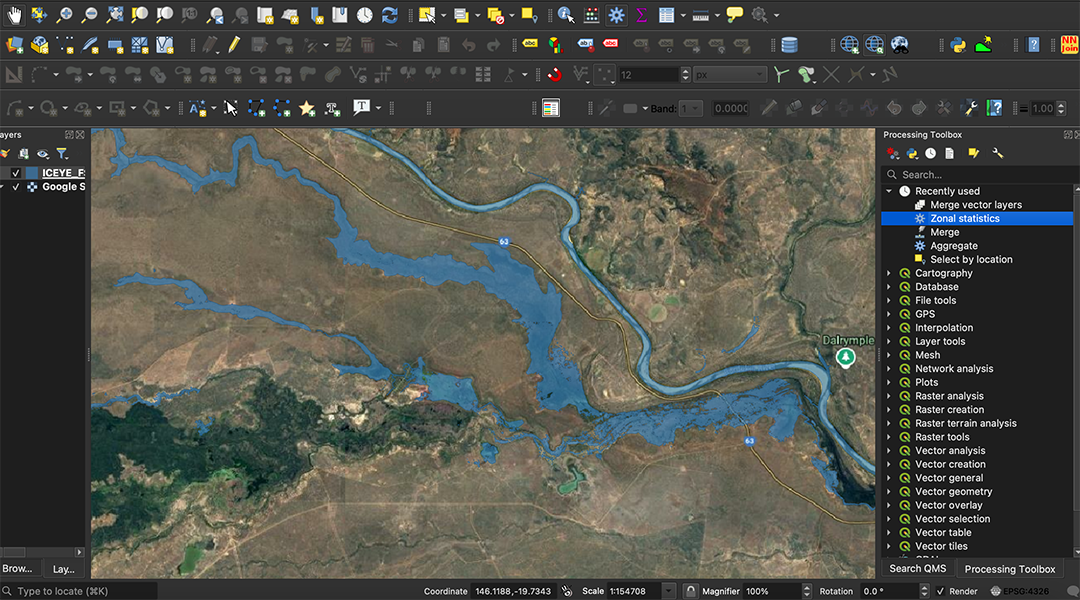
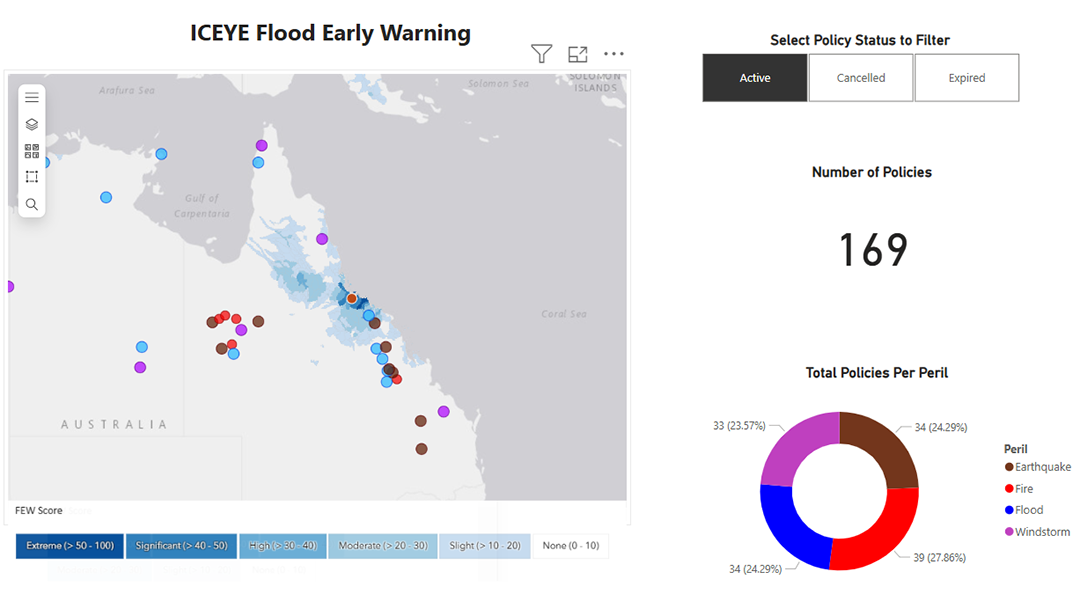
For those seeking advanced capabilities without purchasing additional software, we recommend free tools like QGIS and Power BI. These platforms allow you to load and analyze your locations with ICEYE flood data and export insights to Excel.
QGIS provides more advanced analytical capabilities and is an excellent choice for users with geospatial skills or those eager to learn. It offers powerful tools for in-depth analysis, making it ideal for more advanced users.
On the other hand, Power BI is a great option for users with less geospatial expertise. It provides an intuitive interface for visualizing and sharing insights from your data, without requiring advanced geospatial knowledge.
Additionally, ICEYE offers tailored training sessions upon request, ensuring that each client receives the specific knowledge and support they need to effectively utilize our solutions.
If your organization uses GIS platforms such as Esri ArcGIS Pro, ICEYE flood data can be easily uploaded onto these platforms and overlaid with your exposure data. This allows your team and other platform users to fully integrate and customize your experience with ICEYE Flood Insights.

As mentioned above, ICEYE partners with a range of third-party platform providers to ensure seamless access to flood data across a variety of systems. Whether you’re using claims management platforms such as Guidewire and Duck Creek, exposure management solutions like EigenRisk and Opterrix, geospatial analytics software like Insurity, property analytics such as Nearmap, or event response & planning solutions like Arturo, we’ve got you covered. If you are already using a platform provider we don't currently partner with, we’re always open to expanding our network to better meet your needs.
We believe that every organization, regardless of size or technical capability, should benefit from actionable flood insights. Whether you are a small team needing simple access to flood data or a large enterprise looking to integrate advanced flood data into your systems, ICEYE offers a range of options that scale with your needs.
When integrating ICEYE flood data, we work closely with your team to develop a detailed implementation plan. This plan considers your existing technical resources, desired outcomes, and timelines. Whether your end goal is full automation or initial data visualization, we ensure you’re supported every step of the way.
From easy-to-use web tools to complex integrations, we ensure that our customers can make the most of our data, regardless of their technical skillset. We can help you unlock the full potential of flood data to improve decision-making, reduce risks, and enhance resilience to flooding.
Are you ready to get started?
Reach out today to explore how ICEYE’s flood solutions can support your organization’s unique needs.

05 March 2025

16 December 2024
20 November 2024