Contact us
Get in touch with our experts to find out the possibilities daily truth data holds for your organization.


have to admit that 2025 is, so far, in desperate need of a bit more love. So, when I came across this opportunity to mix romance and some geeky RADAR technology, I had to write a post about it.
 Image 1. A message in a field captured by an ICEYE SAR satellite from 540km above. The image is called a Coherence Map, which is made from two separate 1m resolution, 15km x 15km SAR satellite images taken on two different days.
The image you are looking at was sent to two of my Canadian colleagues, Qiaoping Zhang and Michael Wollersheim, by Dr Heather McNairn, who is one of our research partners working at Agriculture and Agri-Food Canada.
Dr. McNairn’s team have been working to develop a method that would use radar satellites to detect when farmers till their fields. This is an important topic in climate studies, since tillage can have a significant impact on soil CO2 emissions. The ICEYE team were keen to support their research by contributing rapid-revisit SAR data to help provide some insight into crop monitoring, so they could better understand sustainable tillage practices.
Their test site is a region near Russell, Ontario in Canada. In order to know what is happening on the ground, their team of scientists (Omar Gaweesh, Sam Schultz, Xianfeng Jiao) would visit the fields weekly and record their observations.
So we started a bit more digging into the story (and a huge thank you to Heather and her team at Agriculture and Agri-food, Canada for solving this puzzle and actually locating the crop-owners to fill in the details of this romantic tale).
Before I get into the interesting part of the story, I want to talk a bit about what we are seeing here, because this is no normal picture from space. What you are looking at in Image 1. is called a Coherence Map (also known as coherent change detection), which is made from two separate 1m resolution, 15km x 15km SAR satellite images taken from the ICEYE fleet on two different days.

Image 2. The first of two 15km x 15km SAR satellite images. This was taken on the 14th of October.
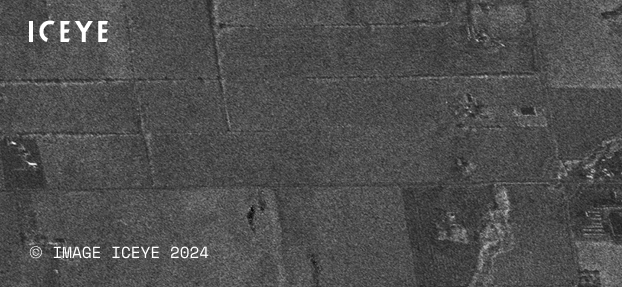
Image 3. A zoom-in of the first image, which was taken on the 14th of October, 2024.
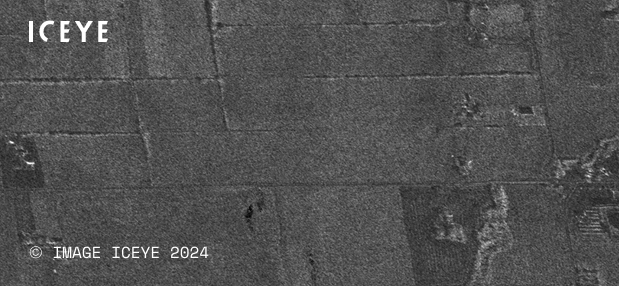
Image4. A zoom-in of the second image, which was taken on the 20th of October, 2024.
Both zoom-in images (Image 3. and Image 4.) are pretty mundane - a few fields in rural Ontario, Canada - not much difference between them. Curiously, in neither case is it clear from just the image that there is a message in here. So how did we uncover the hidden message? The secret is to exploit one of SAR's 'super powers': phase coherence!
When we make these images, our satellite transmits a series of low power pulses of microwave energy from space. These pulses pass through the clouds, reflect off the ground and bounce back to our satellite, where they are recorded by the satellites' incredibly sensitive and precise receiving equipment.
The SAR image is made by adding the pulses together in such a way that a huge microwave ‘lens’ in space is formed - a bit like a camera, but using invisible (to the human eye) microwave light rather than visible light.
There is a useful way to represent this phase information by considering the transmitted pulse as a sinusoidal wave transmitted from the satellite to the ground and back (Image 5. Phase diagram below). The RADAR measures the amplitude of this wave and also the fractional position along its length.


Image 5. Phase diagram
We can show this measurement as a diagram called a ‘phasor’ (Image 6. below)
.jpg)
Image 6. Each pixel in a SAR image can be represented as a phasor, with the length of the green arrow (the amplitude) being the RADAR reflectivity of the object in the image - we display this as brightness from a really small arrow being ‘black’, and a really long arrow being white. The angle information, also known as ‘the phase’, is also part of the pixel.
Image 7. We don’t usually display the phase information in each pixel. It has important information in it, but it's not that easy for humans to exploit, so it is usually discarded. Here is what the phase information looks like (white is 0 degrees phase and black is 360 degrees phase). It just looks like noise to us.
There is one part of this simple model that is not quite correct. In reality, each pixel in the SAR image contains not one but many, many individual reflectors. These could be blades of grass, soybeans, rocks, or grains of sand, shown here as differently colored and sized triangles within an image pixel.
 Image 8. Individual reflectors, e.g., blades of grass, soybeans, rocks, or grains of sand
So the phasor stored in each pixel is actually the composite of adding the phasors of all the individual contributors together, tip to tail, to make a single observation (shown in Image 9. below).
 Image 9. Illustration
Why is this important? Well, as you can imagine, the human eye cannot tell the difference in the RADAR reflectivity (the brightness change) of a few soybean leaves in a field. This is why the first and second original SAR images look pretty identical.
But tools that know how to use the additional phase information can spot this difference.
Because we keep this extra phase information in each SAR image, we can look at how it changes from one day to another - allowing us to see changes that are often invisible to the human eye - even when a human is standing next to them.
To see how this works, lets move one individual scatter by a few centimeters in the previous image:
 Image 10. Example of phase information changing in the space of two days
In this example, the little dark green triangle represents a single reflector inside the SAR image pixel. When the SAR Image is formed, the phasor that represents the pixel is represented by the large black arrow. On the second day (second image), the little dark green triangle has moved a few millimeters. You can see that while the large black arrow remains approximately the same length (same pixel brightness), the angle of the large black arrow (the phase) is very different.
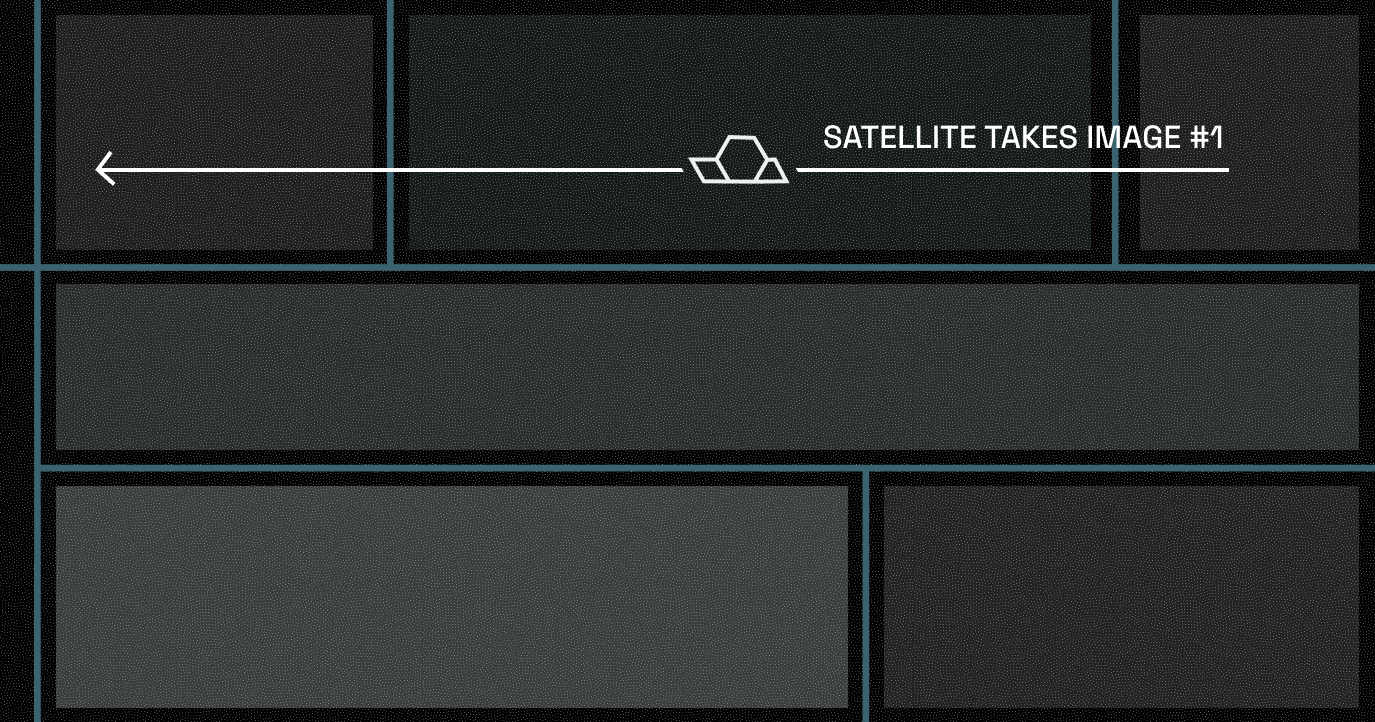
Image 11. First satellite image over a field.
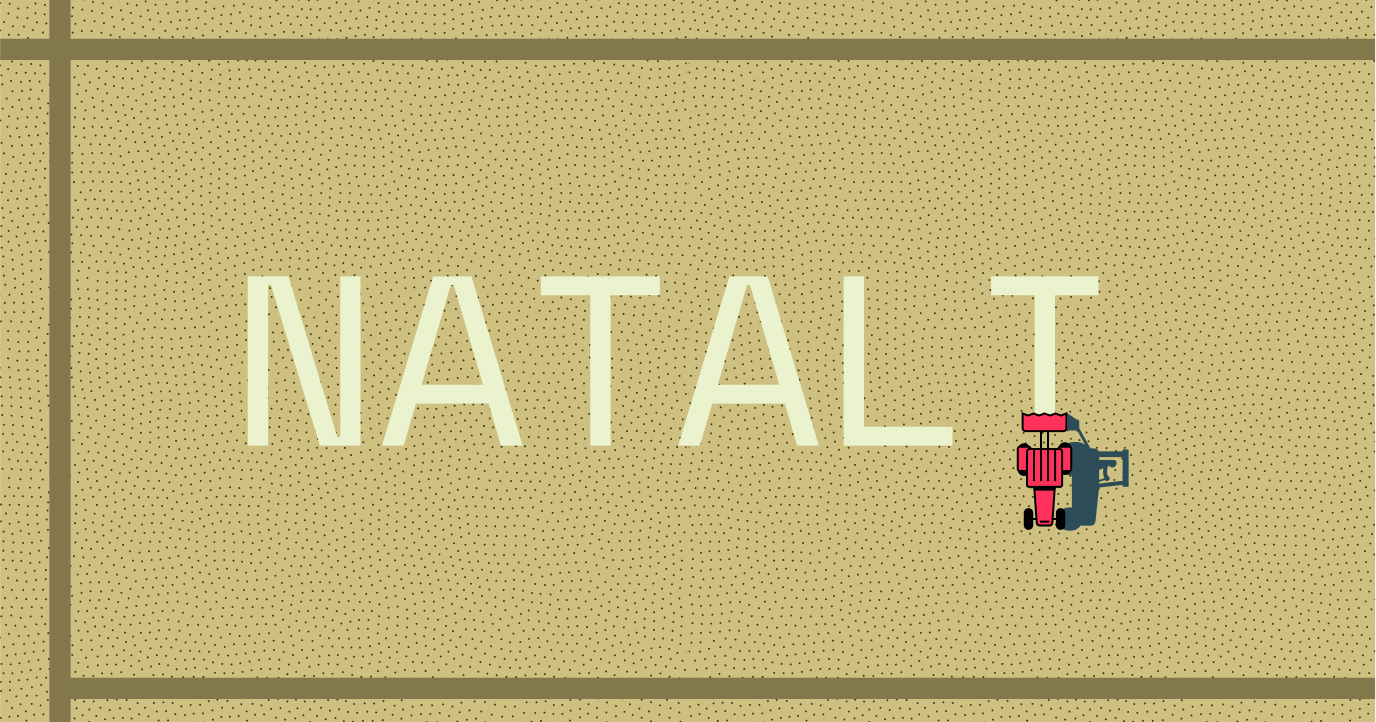
Image 12. Tractor drives in the same field.

Image 13. Second satellite image taken over the same field.
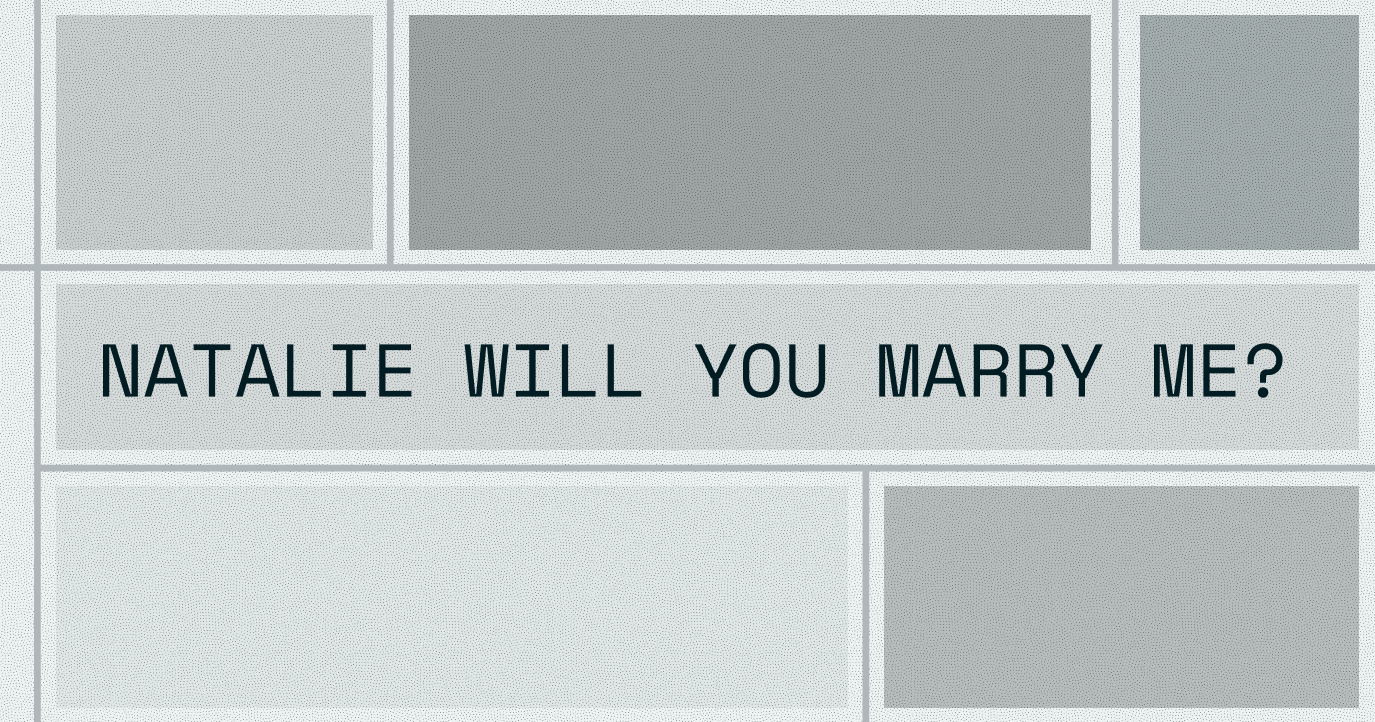
Image 14. Changes made by the tractor picked up by comparing the phase with the first!
The coherence map shown in Image 1. is made up of the difference in the phase information of the individual phasors between the two images. When the phasors are identical on both images, then the pixel is colored white. If the phasor is different, then the pixel takes on a shade of grey representing the amount of difference in phase between the two pixels.
So when a farmer drives over the crop, after the first image has been collected, it changes the phase only in those locations where the wheels of the tractor move the crop. These changes appear as the black words in the image. In locations where the crop didn’t change by much, it takes on a white or lighter colour. As a result, you not only see the letters in the image - but you can also see the route the farmer took to make the letters.
(obviously this is a simplified explanation - the amazing engineering that is needed to form this image is pretty impressive, and a subject for another day - by smarter people).
So, the protagonist of the story is a farmer called Mark Nyentap. He had been dating his girlfriend Natalie for a little over a year, and finally it was time to make a commitment. Natalie loves surprises, so he decided to make this proposal extra special. Working with his friend, he worked out how to program his John Deere tractor to use its on-board GPS system to write the letters in one of his soybean fields. There were 26 characters, and the field was 2600 ft long, so each character was 80-100 ft wide by 200 ft tall. It took two days with the help of his parents to write the inscription. This was on the 17th and 18th October 2024.
As you can see, he did a pretty good job.

Photo Mark Nyentap
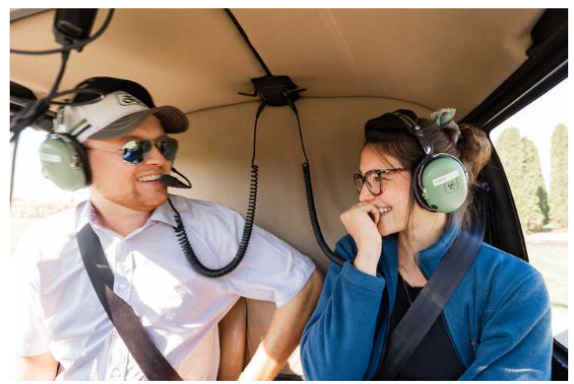
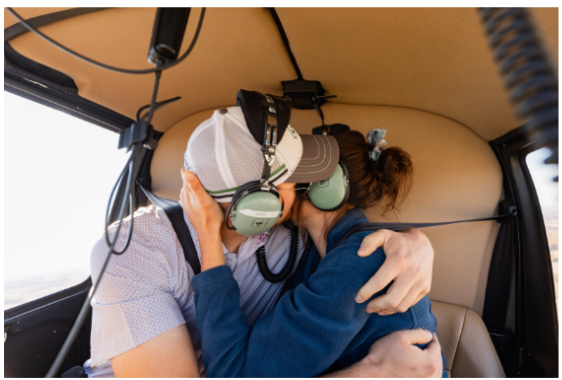
On the 20th October, Mark and Natalie embarked on a planned hiking trip to see the autumn colours. He picked her up from her house, took her for breakfast, and then, rather than heading to the hike, he headed to the aviation museum in Ottawa. He told Natalie that he wasn’t really in the mood for a hike, so (after contriving to get Natalie to eat some anti motion-sickness medication - nice touch 🙌) he told her he had arranged to see the colours from the air instead. Natalie was pretty excited with the change of plans, and the pilot (and photographer) arranged to sneak up on the field so that Natalie only caught sight of the proposal at the last moment. When she read the message, she was stunned, slowly turning round to see Mark, who was holding out the ring for her.
She said ‘yes’ straight away, and they landed at Mark’s parents' property, where the entire family was waiting for them (expectant to hear the good news).
Mark and Natalie - she said Yes!
Photos Mark Nyentap
By the 8th of November, the message had been wiped out by the ever-encroaching needs of the farm. But fortunately, the eagle-eyed team at Agriculture and Agri-food spotted the message, and contacted ICEYE.
We were really pleased to see this. It's a great example of how RADAR imaging techniques can see subtle changes from space. (This is really important if you are trying to get ahead of disasters and important events). It was also useful to be able to see how transient the change was (a day or two before the message was lost), and the resolution needed to not only see, but also clearly read the message of this kind of activity (less than a metre).
Mark and Natalie are getting married in August, 2025!

Photo Mark Nyentap

23 January 2026

06 November 2025

27 June 2025