Contact us
Get in touch with our experts to find out the possibilities daily truth data holds for your organization.
Persistent Monitoring
Natural catastrophe solutions
17 December 2024 | Earth Observation,Data,Missions
13 min read
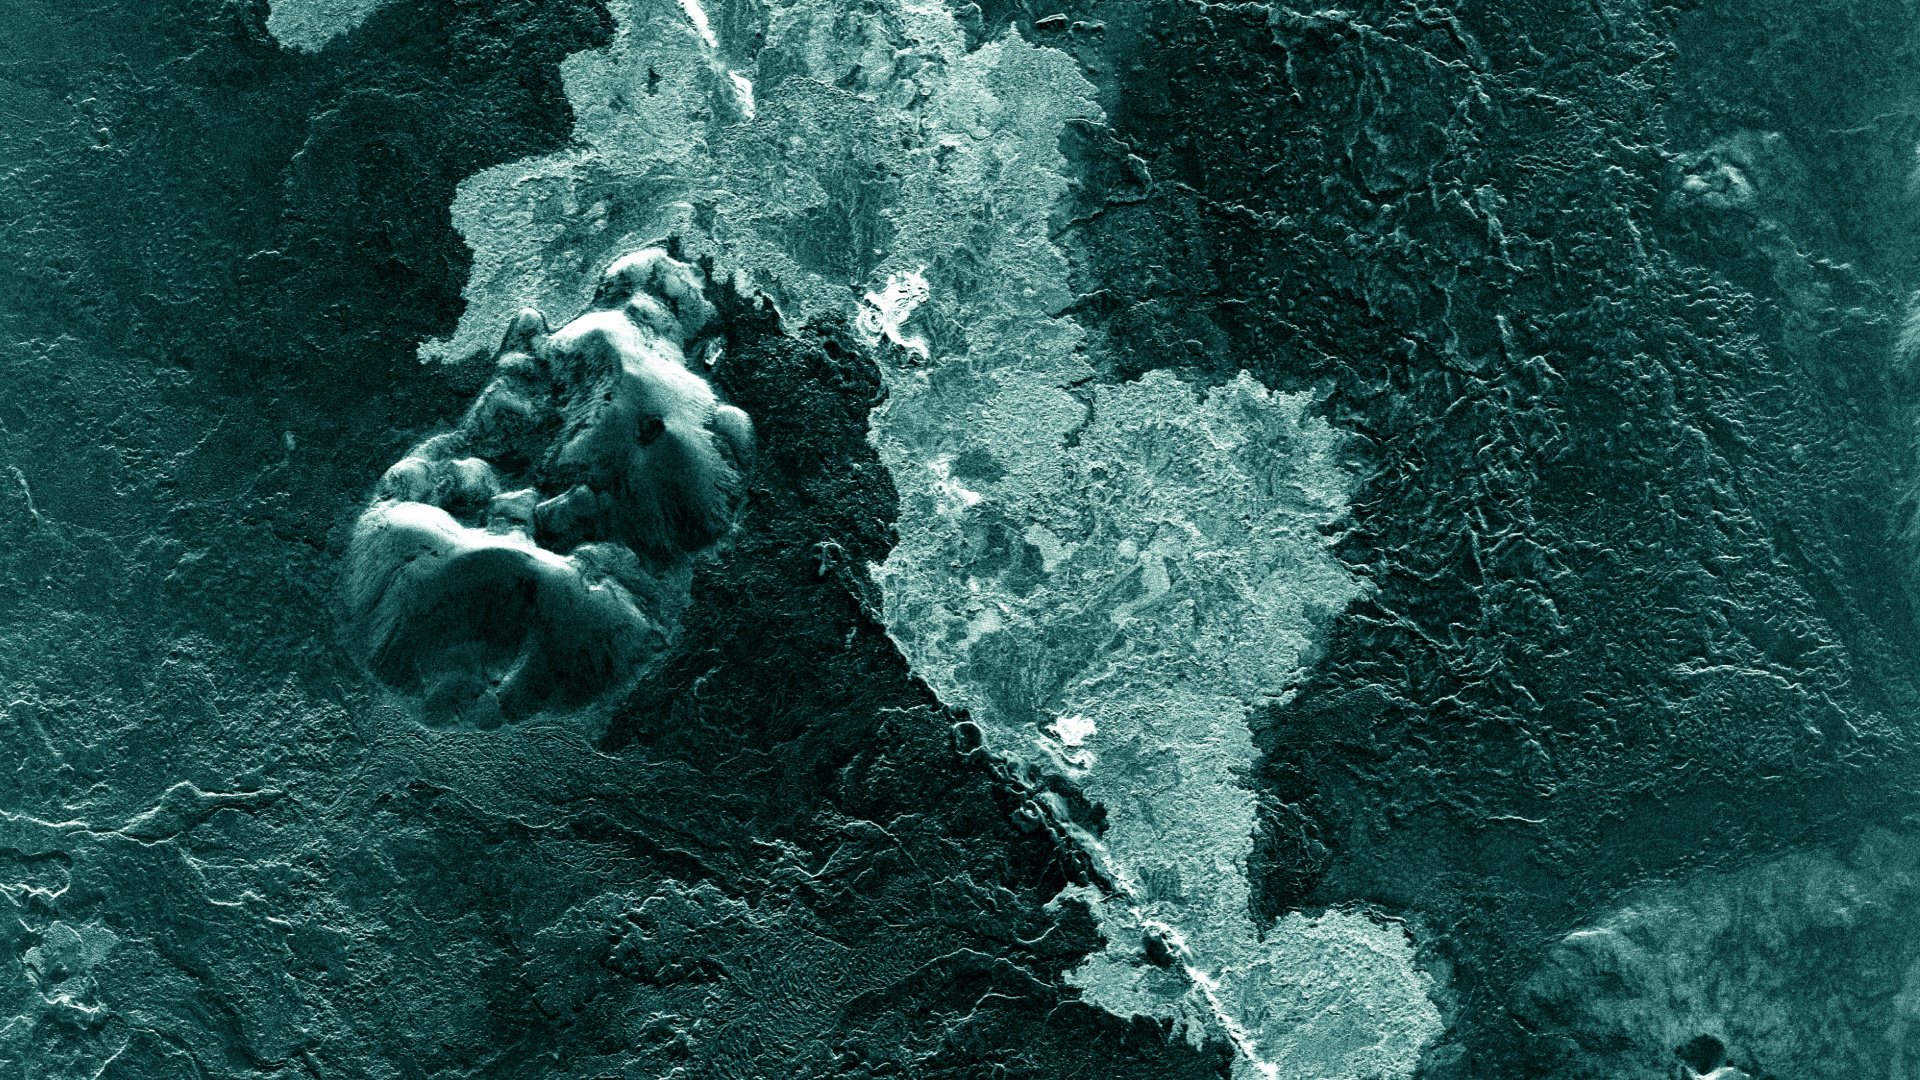
How do we know what is happening on Earth? If we read or watch the news, we can only get snapshots. If we search on social media, we struggle to find information we can trust.
With remote sensing from space and airborne systems, however, we can get a scientific, quantitative glimpse of the Earth’s surface, enabling us to answer pressing questions about the world as it is today. How fast are cities expanding? Are this year’s crops healthy? Which population centers are threatened by natural catastrophe events?
In this blog post, we are going to look at some of the specific ways in which SAR can be used to help monitor and respond to events on our rapidly changing Earth.
Optical remote sensing systems have some limitations, similar to those of our own eyes. They cannot operate at nighttime because they need illumination from the sun.
They also cannot operate when it is overcast because optical wavelengths do not penetrate clouds, smoke or haze. This is a real problem because 67% of the Earth is covered by clouds annually and only around 10% of the sky is completely clear at any given time.
Synthetic aperture radar (SAR) systems, on the other hand, provide their own source of illumination and use wavelengths that are unimpeded by our atmosphere. They are therefore able to provide information about any point on the planet at any time of the day or night.
Most of the observable components of change on earth are the result of human or geological activity. Often, they are a combination of the two.
Let's look at some examples of the human-made and geological changes that we measure using SAR:
SAR is extremely useful for monitoring illegal deforestation because the places where the risk is highest (such as the Amazon) tend to be cloudy for much of the time.
The image below shows how ICEYE uses SAR to capture tree loss with great precision. This is partly due to the high ground resolution of SAR images. It is also because SAR uses X-band wavelengths, which are especially sensitive to tree foliage.
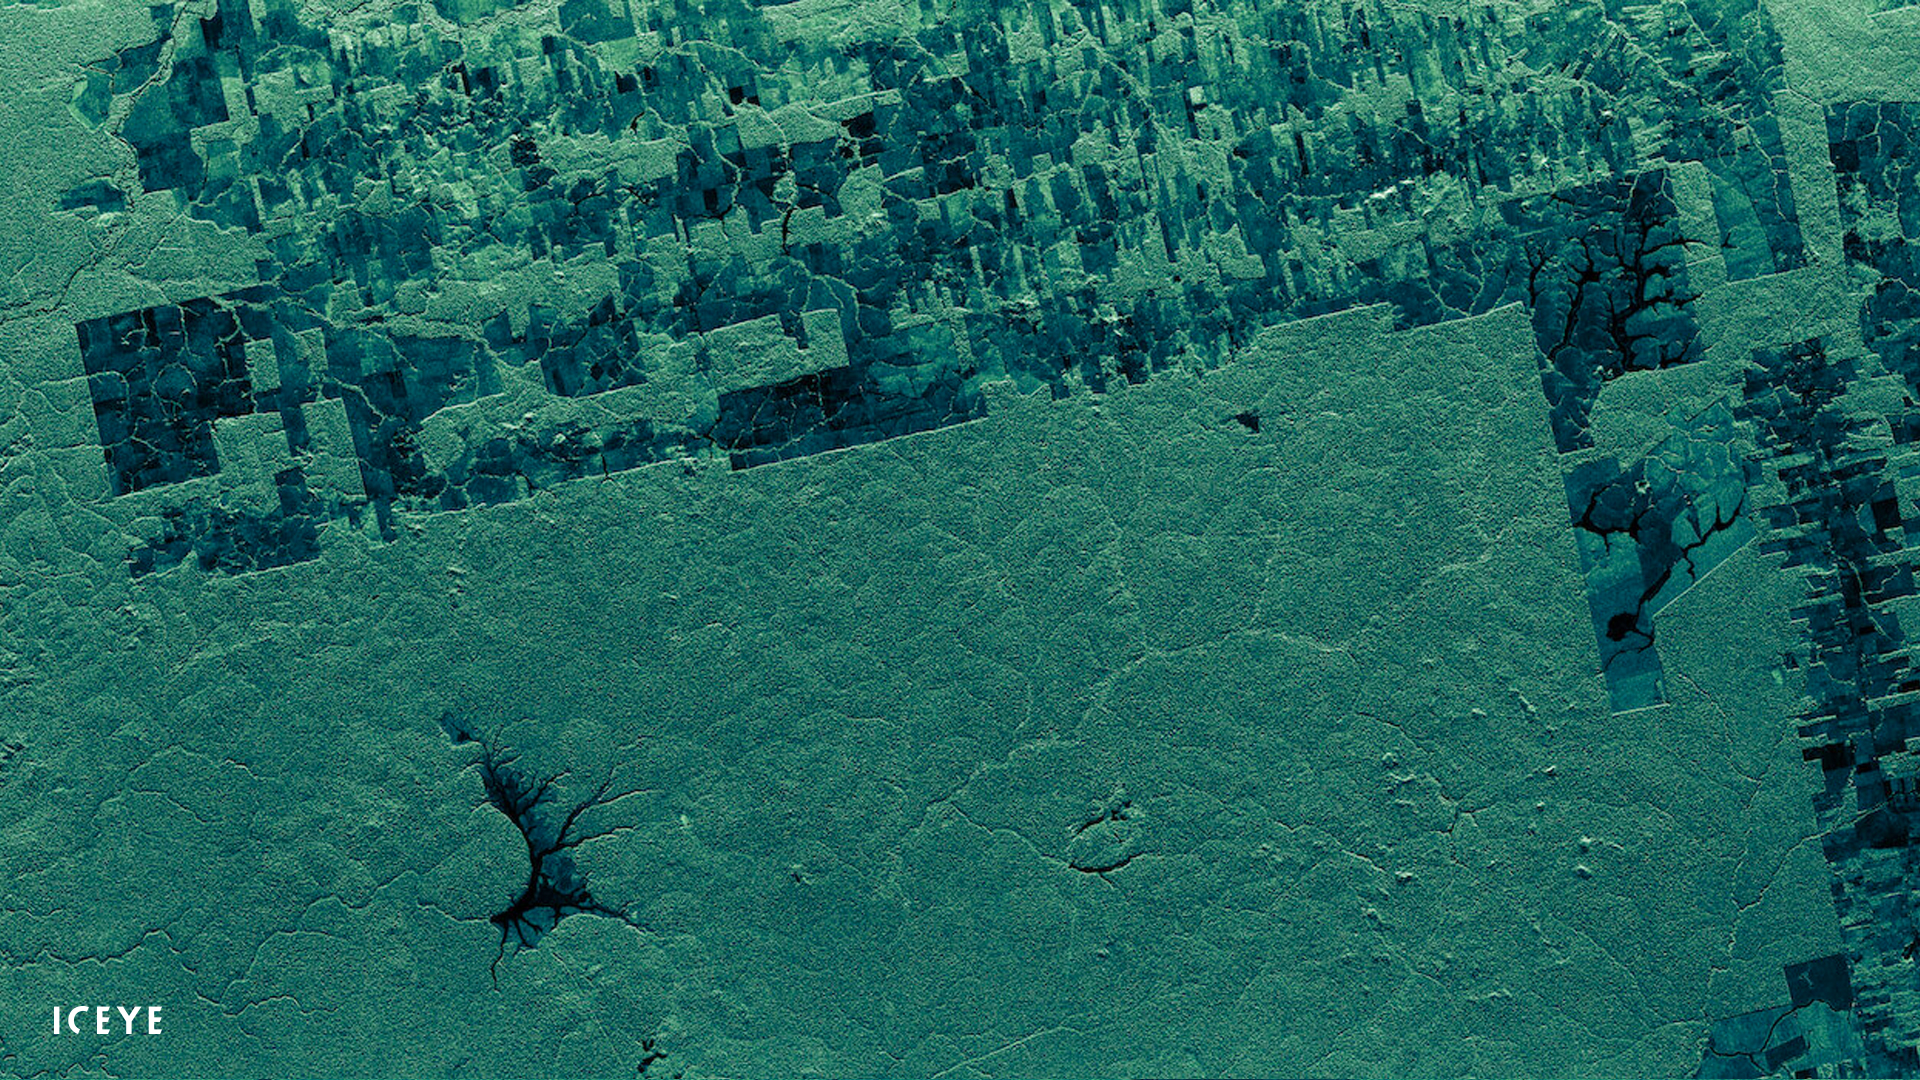
SAR image of deforested areas in the Amazon.
The large oil storage tanks in the port of Rotterdam have floating lids that move up and down, depending on how much oil is in the tank. By monitoring the positions of these lids, we can provide users with accurate insights into global economic activity and the state of the world’s oil supplies.
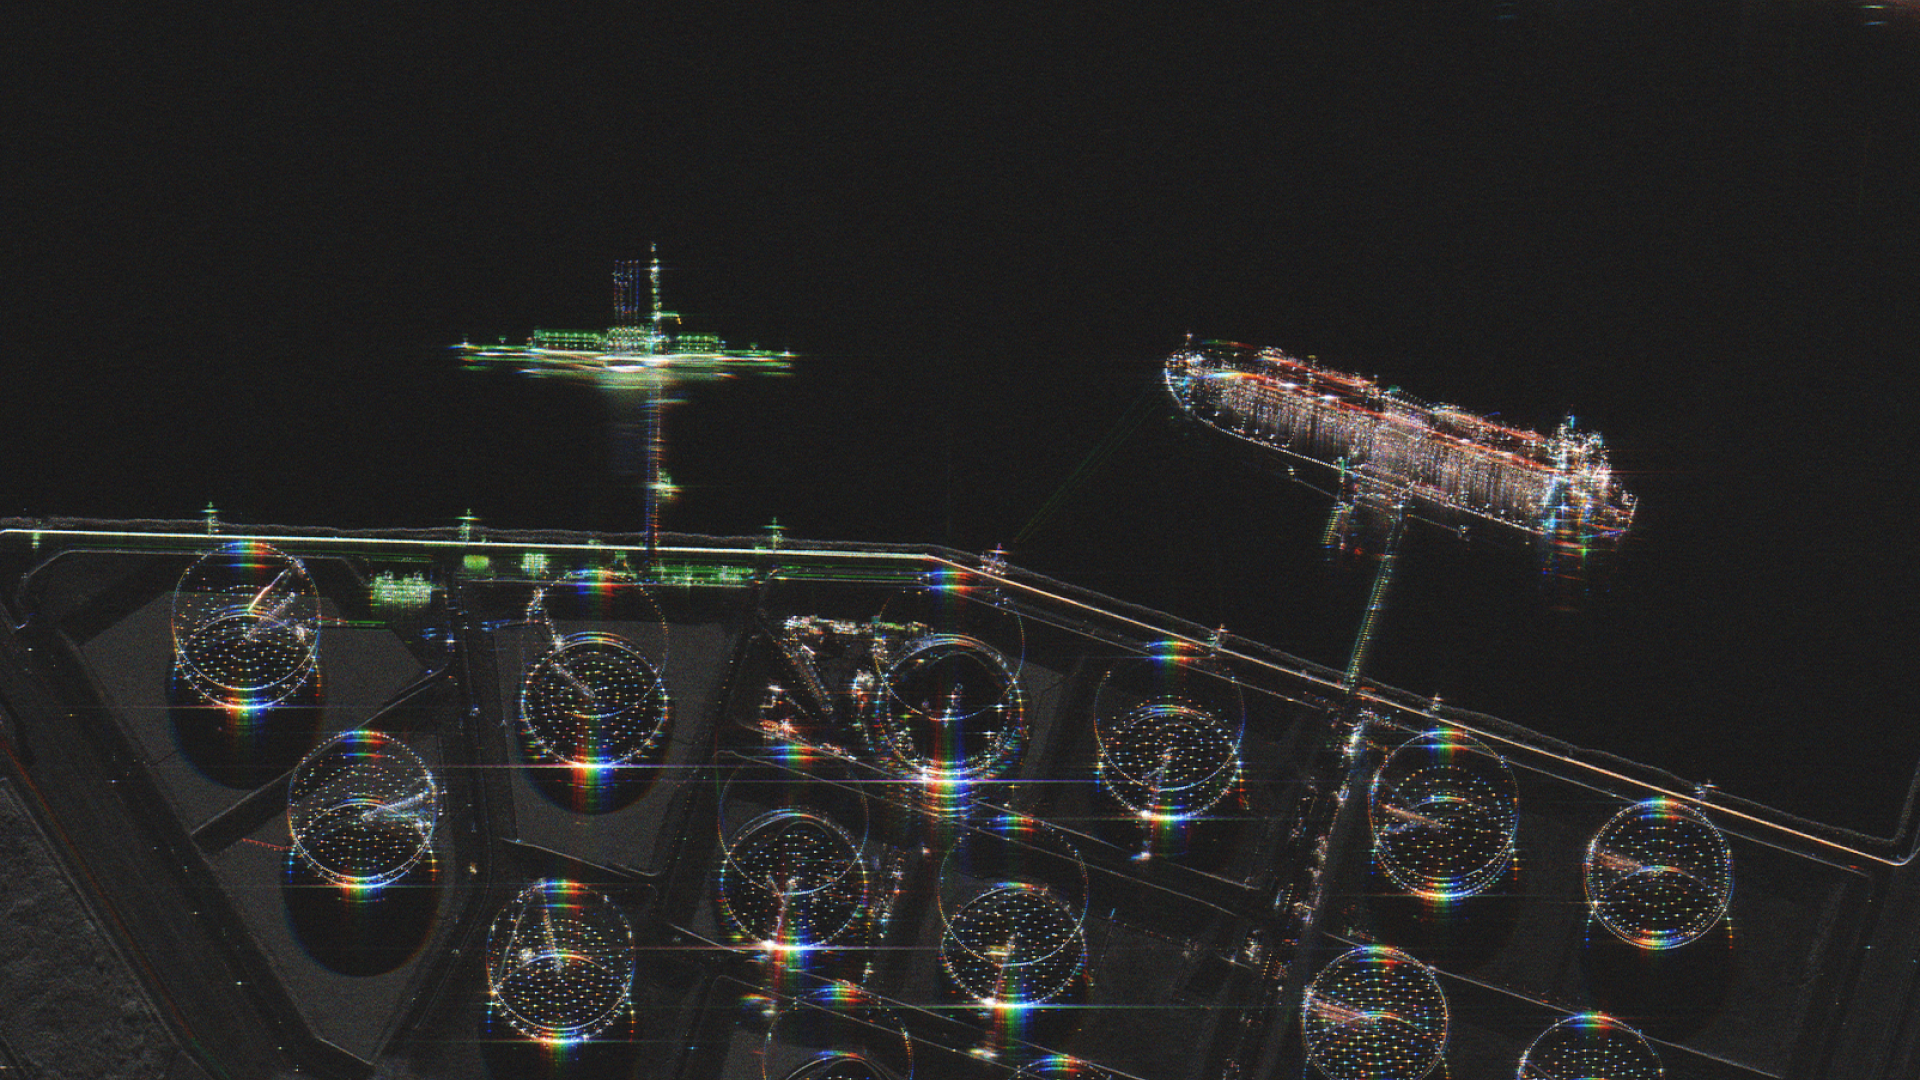
Oil storage tanks in the port of Rotterdam, The Netherlands. ICEYE Dwell Precise mode image.
Warm water from the Southern Ocean impact Antarctic glaciers, which, in turn, contribute to the rise of sea levels. Thwaites Glacier in West Antarctica is a significant contributor to sea level rise, and is being closely monitored. An article published in The Proceedings of the National Academy of Sciences (PNAS) documents the results of using interferometry data from the ICEYE constellation collected in March–June 2023 to document an ice grounding zone.
ICEYE has been using SAR technology to record and monitor glacier movement over time.
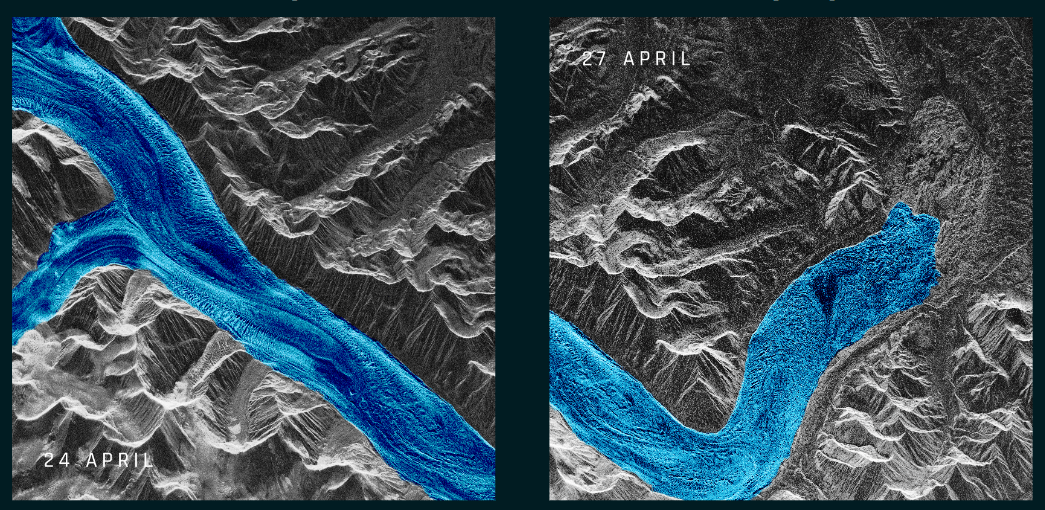
Daily imaging is important when monitoring glaciers .
In 2021, ICEYE monitored the eruption of the Fagradalsfjall volcano in Iceland (see image below). Over 26 days, seven different fissures opened up and poured lava out onto the earth. By working in collaboration with the University of Iceland and the Icelandic Space Agency, we were able to create an underlying predictive model based on the daily observations being made through SAR technology. Being able to anticipate where new fissures are going to appear is critical from a public safety perspective, especially in tourism-driven locations like this one.

Using interferometry, we can also create three-dimensional images of the same area that show with precision how the volcano has changed due to subsidence. The colors in the image below represent the different extents to which the volcano’s structure has deformed over the course of the eruption.
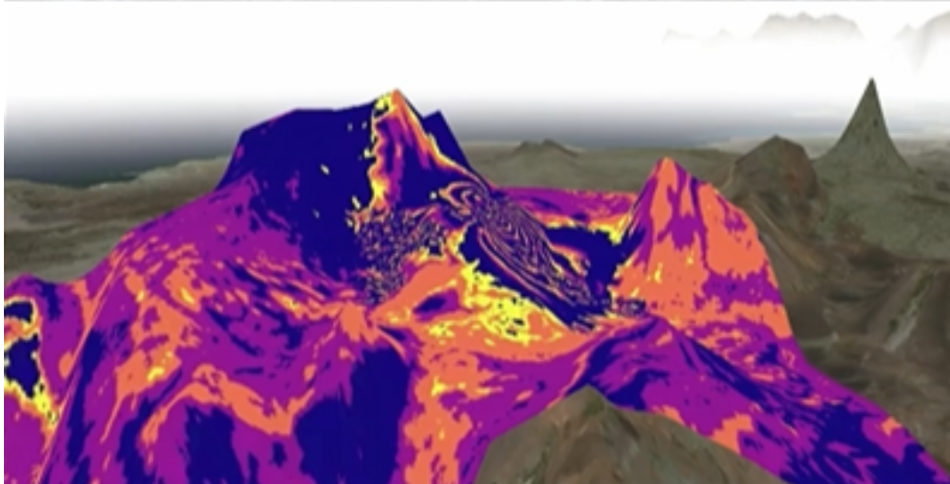
Volcano monitoring in Iceland with interferometry
By their very nature, flood events tend to be accompanied by bad weather. This makes flood monitoring an ideal use case for SAR technology, which, as we saw above, is not impacted by clouds, rain or fog.
The image below captures the progress of a significant flooding event in Honduras in 2023. You can see the affected river snaking across to the bottom-right corner of the image. SAR collections of this area were made every 24 hours over a three-day period, and the three signals were then projected in different colors: red for day one; green for day two; blue for day three. Combining the three produces an image where changes to the environment are color-coded depending on what day they occurred. In this way, SAR can offer a snapshot of a dynamic event that may unfold over days, weeks or even months.
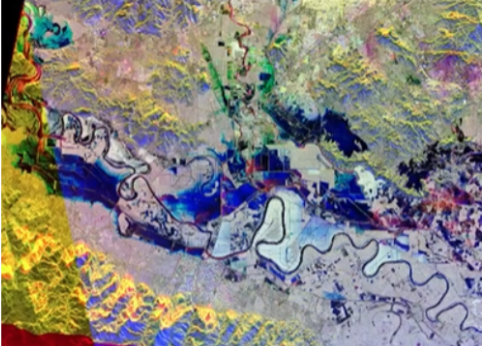
Honduras, 2023
SAR can also be used to measure flood events at a street-by-street and even building-by-building level, as illustrated by this image of an area of New South Wales, Australia, taken in April 2023.
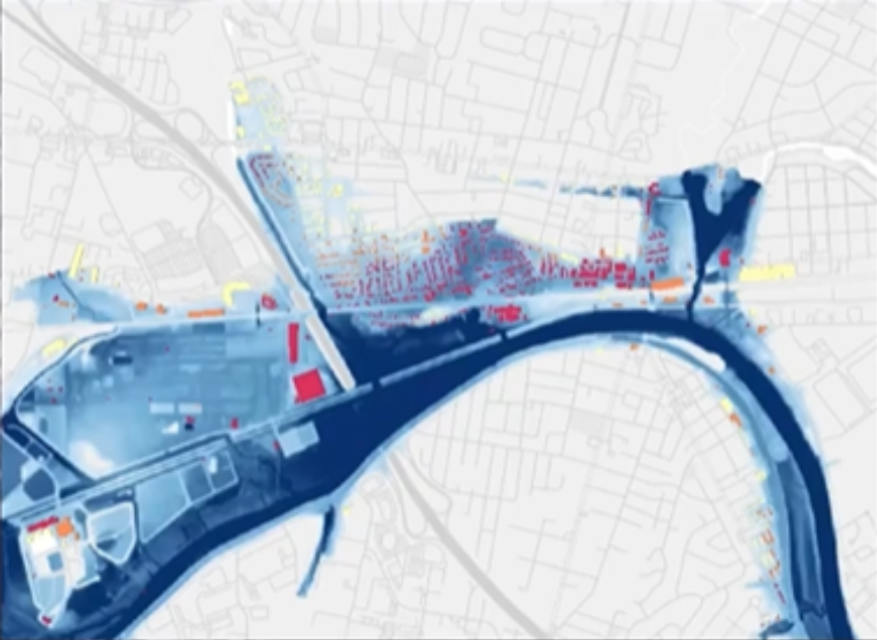
Measuring flood with SAR, New South Wales, Australia, April 2023
We saw above how SAR enables us to create a wealth of information on specific locations, and to monitor those locations over extended periods of time. In fact, this capacity for persistent monitoring is one of the principal advantages of SAR technology.
By using a persistent monitoring technique called persistent scattering interferometry we can measure ground displacements very precisely over time. Put simply, this technique involves comparing images of the same area collected over days, weeks or months, and then using phase differences to measure how much objects in the area have changed.
Many of the changes we observe through persistent scattering interferometry are humanmade (vehicles moving, buildings being demolished or built etc.). Some of them can be due to vegetation change. But the real power of this technique is its ability to measure the sinking and rising of the Earth itself.
Take the image (below) of the Mosul Dam in Iraq. As you may know, there have long been concerns about the instability of this dam and the potentially catastrophic impact any failure of the structure could have on downstream populations.
The red ‘hot spots’ in the image indicate where our SAR sensor has detected subsidence; the blue spots indicate areas where little has changed. As you can see, the image enables us to identify and respond to specific sinkholes that could put the dam’s integrity at risk.
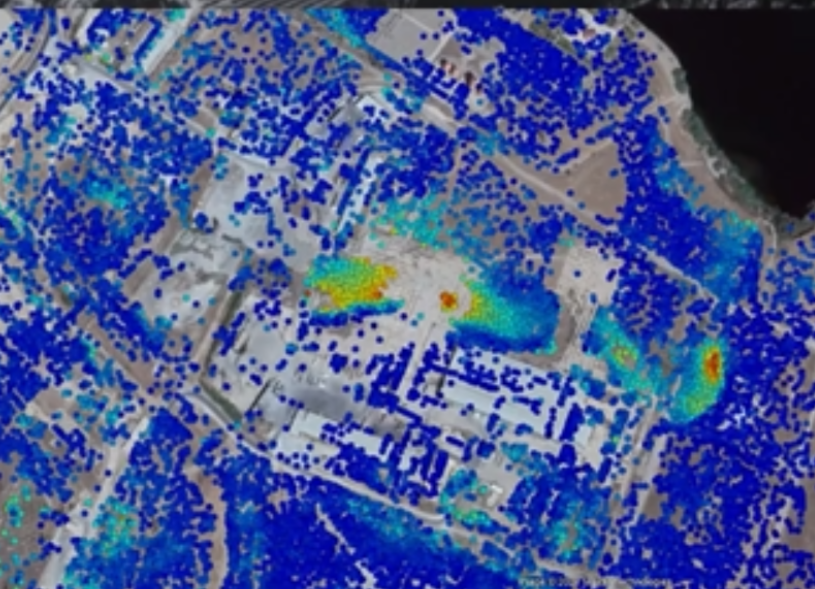
Using SAR to identify sink holes, Mosul Dam, Irak
We have looked at some of the most common examples of humanmade and geological changes that can be observed through SAR. There are many more we could share with you if we had the time and space.
How can people harness this wealth of information about our changing Earth? Most applications, we believe, fall under one of three key pillars:
1. Understanding economic risk
SAR images can be used to identify where and how key events are going to unfold and what the financial implications of them will be. The information can also be used to target investment to ensure locations are better prepared.
2. Building societal trust
In SAR images, the reality is not obscured behind analytics and data. What is happening on the ground is plainly observable and can be physically verified by anybody who visits the location for themselves.
3. Managing environmental change
Governments and individuals can use SAR images to track and prepare for environmental changes. SAR can also furnish them with the observational evidence they need to create a more sustainable world.
In our next article, we’re going to explore how phase information can be used to detect subtle changes.

06 November 2025
Beyond the Echo - How satellites steer the radar beam
Shikha Sharma and Leszek Lamentowski reveal the technology behind ICEYE SAR satellite agility.
Read more about Beyond the Echo - How satellites steer the radar beam →27 June 2025
Beyond the Echo - Rapid-fire imaging, on repeat
Shikha Sharma and the ICEYE team explore physical maneuver, electronic beam steering, and optimized...
Read more about Beyond the Echo - Rapid-fire imaging, on repeat →13 March 2025
Harness the magical property of SAR
Learn how phase information - that magical property of SAR - can be combined with persistent...
Read more about Harness the magical property of SAR →