Contact us
Get in touch with our experts to find out the possibilities daily truth data holds for your organization.
In this blog post, we are going to look at some of the hidden properties we can exploit when we think of synthetic aperture radar (SAR) as a multidimensional hologram, rather than simply a two-dimensional image.
In particular, we’re going to explore how phase information (that magical property of SAR) can be used to detect subtle changes on the ground, increase our understanding of the world around us, and predict what might happen in the future.
The electromagnetic field of the X-band pulses transmitted by ICEYE antennae goes up and down 9.6 billion times every second. But the signal that returns to the antenna does not consist of multiple ‘ups’ and ‘downs’. It is merely a fraction of a wavelength.
This fraction is what we call the phase information of the echo. Crucially, the fraction that is measured by the antenna will vary depending on the distance to the ground. Phase is therefore a measure of range.
Amplitude information
The other type of information our antennae collect is amplitude information. This concerns the ‘brightness’ of each echo and varies depending on what kind of structure the pulse has reflected off.
The two types of information we collect through SAR (amplitude and phase) can be combined into something we call a ‘phasor plot' or 'phasor’ (see below).
.jpg?width=354&height=354&name=Phasor%20(1).jpg)
The amplitude (or brightness) is represented by the length of the arrow from the center of the circle to the edge. The longer the arrow, the brighter the echo. The phase is represented by the angle of the arrow from the X axis.
Phasor plots offer a simple and intuitive way to understand what is meant by the amplitude and phase of radar signals returning to space from the ground.
There is an important question you’re probably asking yourself at this point. If each pixel in a SAR image represents a defined area of ground (for example 1 m²), won’t the information the antenna receives from that area consist of multiple values for amplitude and phase?
The answer is, yes it does. In fact, there may well be hundreds or even thousands of individual scatterers per patch of ground, whether they are blades of grass, rocks and pebbles, or grains of sand. And each of these scatterers will have its own radar brightness (amplitude) and its own range from the antenna (phase).
However, by adding up the phasor plots of each of those scatterers, we arrive at a combined result for each pixel of a SAR image. This single measure of phase and amplitude is called a ‘resultant phasor’.
The image below on the left is the kind most SAR users will be familiar with. It depicts the brightness of the ground surface. To create it, we discard the phase measurements for each pixel and use the amplitude measurements alone.
However, we can also view the phase information that sits behind the image - that's the image below on the right. What we are seeing in the image is the phase contribution of each resolution cell, where black equals zero degrees on the phasor plot and white equals 360 degrees (with shades of gray for all the degrees in between). On first appearances, it may look like a sea of noise.
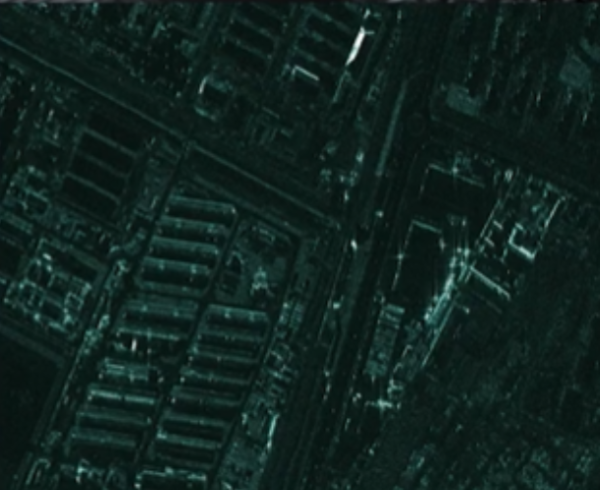
SAR image
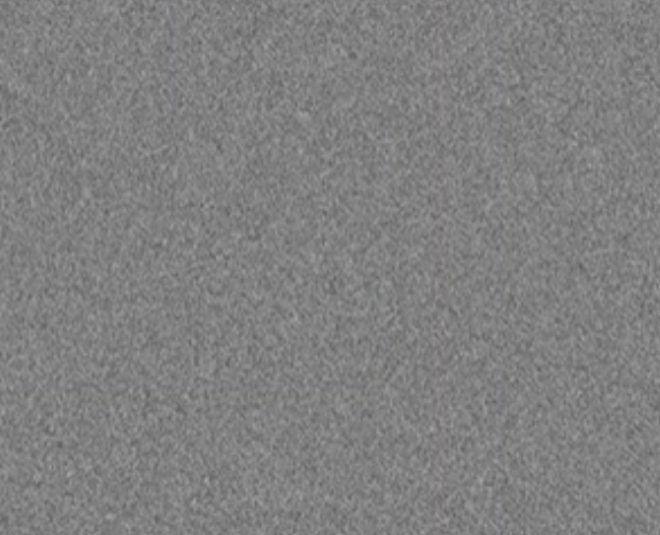
Phase information behind the image.
But zoom in and we can see that there is in fact hidden structure in the phase information (see below), providing us with a tantalizing glimpse into another dimension of the SAR data.
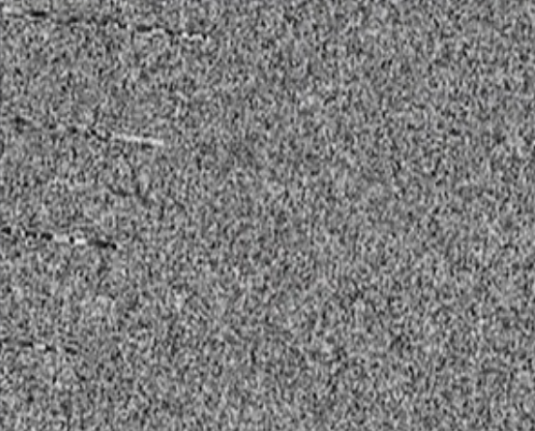
Hidden structure in the phase information.
Is there any way for us to unlock the phase data so we can get even more information about what’s happening on the ground? To answer this question, we need to zoom out for a minute to explore how ICEYE satellites work together as a fleet.
Each ICEYE satellite has its own propulsion system, which enables it to vary altitude above the earth. When you change an orbiting object’s altitude, you also change the amount of time it takes to go all the way around the planet.
By tuning the altitude of our satellites with great precision, we can ensure they are looking at the same point on the ground from the same position in space at the same time each day (this, incidentally, involves them completing exactly 15 revolutions per 24-hour period).
As we saw in our previous article, Monitoring our rapidly changing Earth, this capacity for ‘persistent monitoring’ is one of the key advantages of SAR. It enables us to see how a location changes day by day, whether we’re looking at a flooded city or a glacier’s flow.
However, the level of change that is detectable through persistent monitoring varies considerably depending on whether the amplitude or phase information behind each pixel is used. Why is this?
Well, imagine you rode a bicycle across a football pitch (not recommended). Your tires would most likely leave a thin trail of displaced grass in your wake. The reflectivity of the ground surface would not be affected by this, so the amplitude measure for each 1 m² would remain the same.
The range, however, would be different because the flattened grass would be fractionally further away from the antenna than it was before. This means that, by using phase information, we are able to see changes from one day to the next that would not be visible in an amplitude-only image.
A coherent change image is created by combining phase data of the same location collected on different days. If the phase for a given pixel is the same on both days, then the pixel will be white. If there is a change, it is plotted in a varying shade of gray. If there is no correlation between the phase information on day one and day two, the pixel will be black.
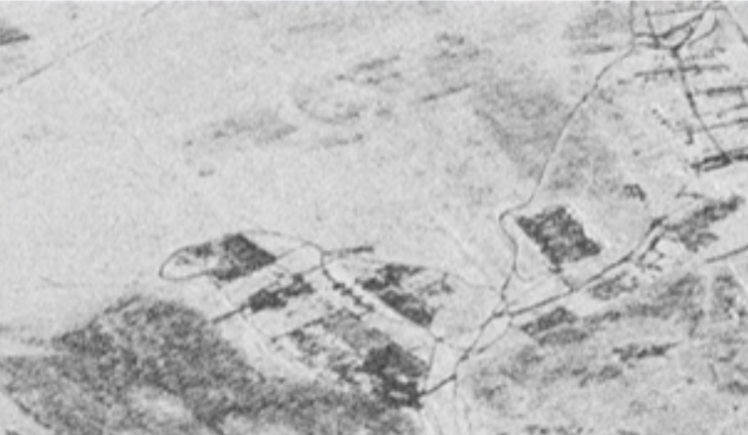
Coherent change
Discovering a message from 540km above
In this way, we can look at a coherent change image like the one above and immediately see areas where nothing has changed (in white), areas where something might have changed (in gray), and areas that are randomly changing all the time (in black), for example bodies of water or trees in leaf.
The longer the gap between the two days, the less useful this technique becomes because, over time, more and more pixels will decorrelate as changes on the ground grow more extreme.
In other words, it becomes impossible to distinguish between areas that are changing randomly and areas that have changed a lot. This is why having the ability to gather data on the same location every 24 hours is so critical.
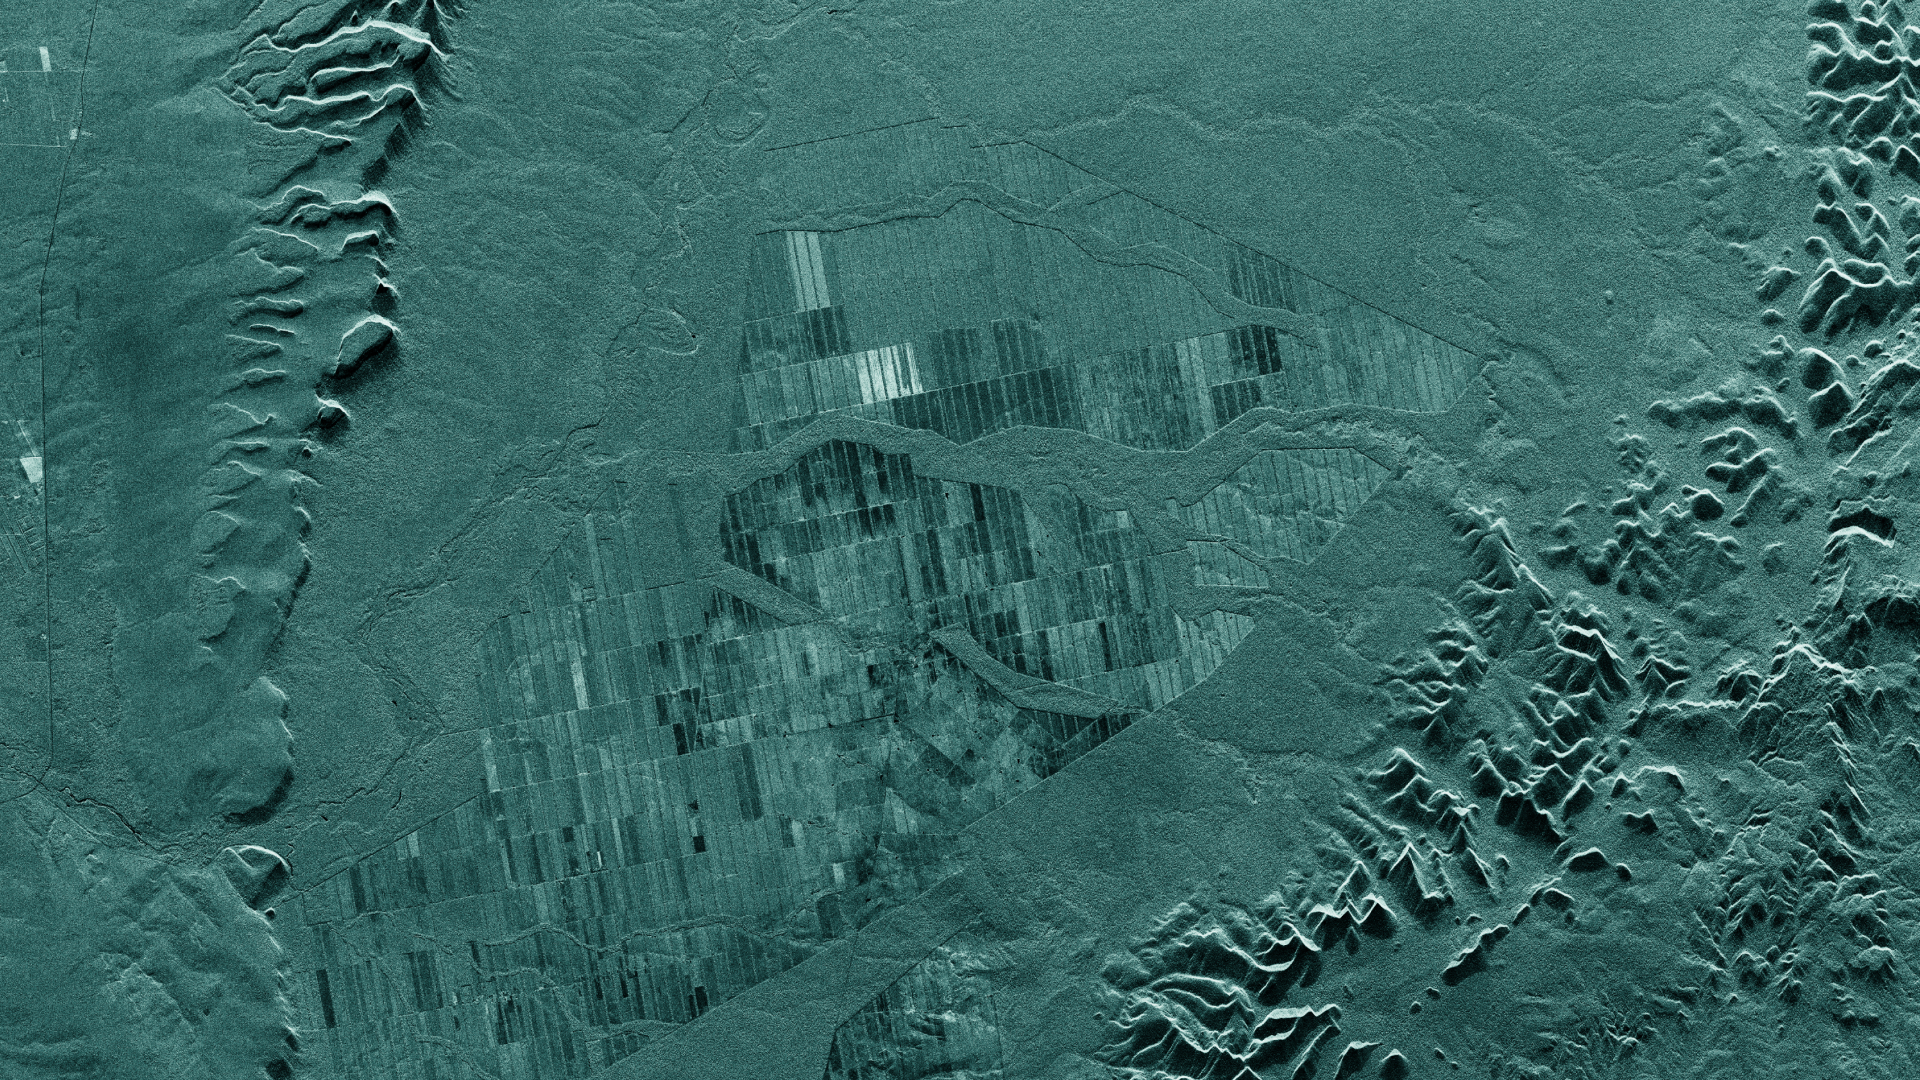
Discovering a message in a field
Using phase information in combination with persistent monitoring enables us to track day-to-day changes over weeks, months and even years.
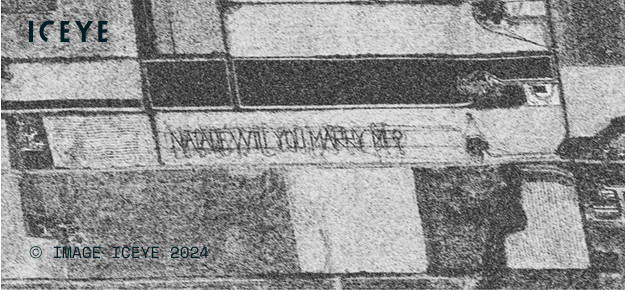
A great example of what can be uncovered using phase information is a message in a field that was revealed by two 15km x 15km satellite images taken on two different days. Read more about the message and how SAR data helps Agriculture and Agri-Food Canada carry out research in Beyond the Echo - Natalie, will you marry me?

We can also use the phase information from a stack of images to take very precise measurements of buildings and other bright objects on the ground.
For example, the ‘point cloud’ image below of our facility in Otaniemi, Helsinki was created using the phase data for the individual scatterers that were consistently brightest across all 96 images in the stack. The result is a highly accurate 3D image of the building.

In this blog post, we have looked at how phase and amplitude information contribute to SAR images, and how precision orbiting enables ICEYE satellites to collect data on the same area of ground at exactly the same time every 24 hours.
Hopefully, you can also begin to see how phase information can be harnessed to provide users with even deeper insight into what’s happening on earth, whether it’s by detecting very small changes that are happening from day to day or by providing very precise range measurements of unchanging structures.
Impressive though the examples we’ve shared with you are, we believe we still haven’t scratched the surface of what phase information is capable of and we are hugely excited about its possible applications in the future.
When the big question popped up in a SAR satellite image captured 540 km up in space, Director of SAR Engineering Darren Muff and the ICEYE team had to take a closer look.


23 January 2026

06 November 2025

27 June 2025